
Share
Introduction
Asset allocation requires a balance between offense and defense. When traditional diversifiers like bonds fail to deliver in an equity market selloff, investors begin to look for alternatives that mitigate drawdown risk without burning capital through purchases of insurance. One such potential solution is managed futures.
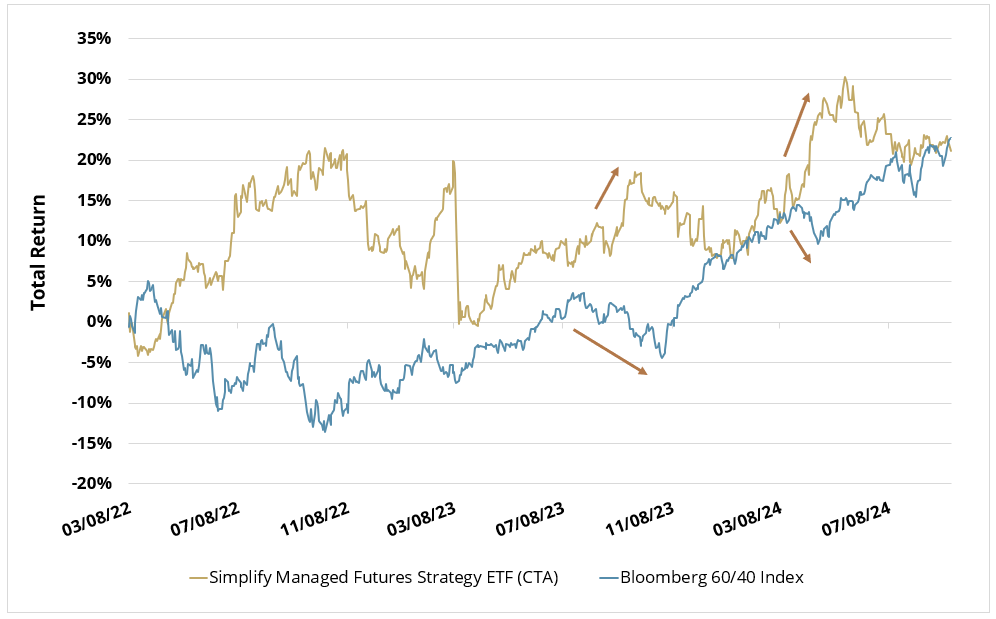
In this Fund Insights post, we discuss how the Simplify Managed Futures Strategy ETF (CTA) offers a compelling solution, providing both diversification and strong performance potential. CTA has not only helped bolster portfolios during an equity market downturn, e.g., 2022 but has also delivered impressive gains in 2024 as stocks have risen. This is shown in Figure 1, where we see CTA’s compelling return profile, which has produced strong absolute returns that can also offset periods when 60/40 portfolios suffer losses.
Figure 1: Diversification When “Diversification” Fails
CTA vs. Bloomberg 60/40 Index, Total Return
03/08/22 - 09/16/24
Negative Correlation When You Need It
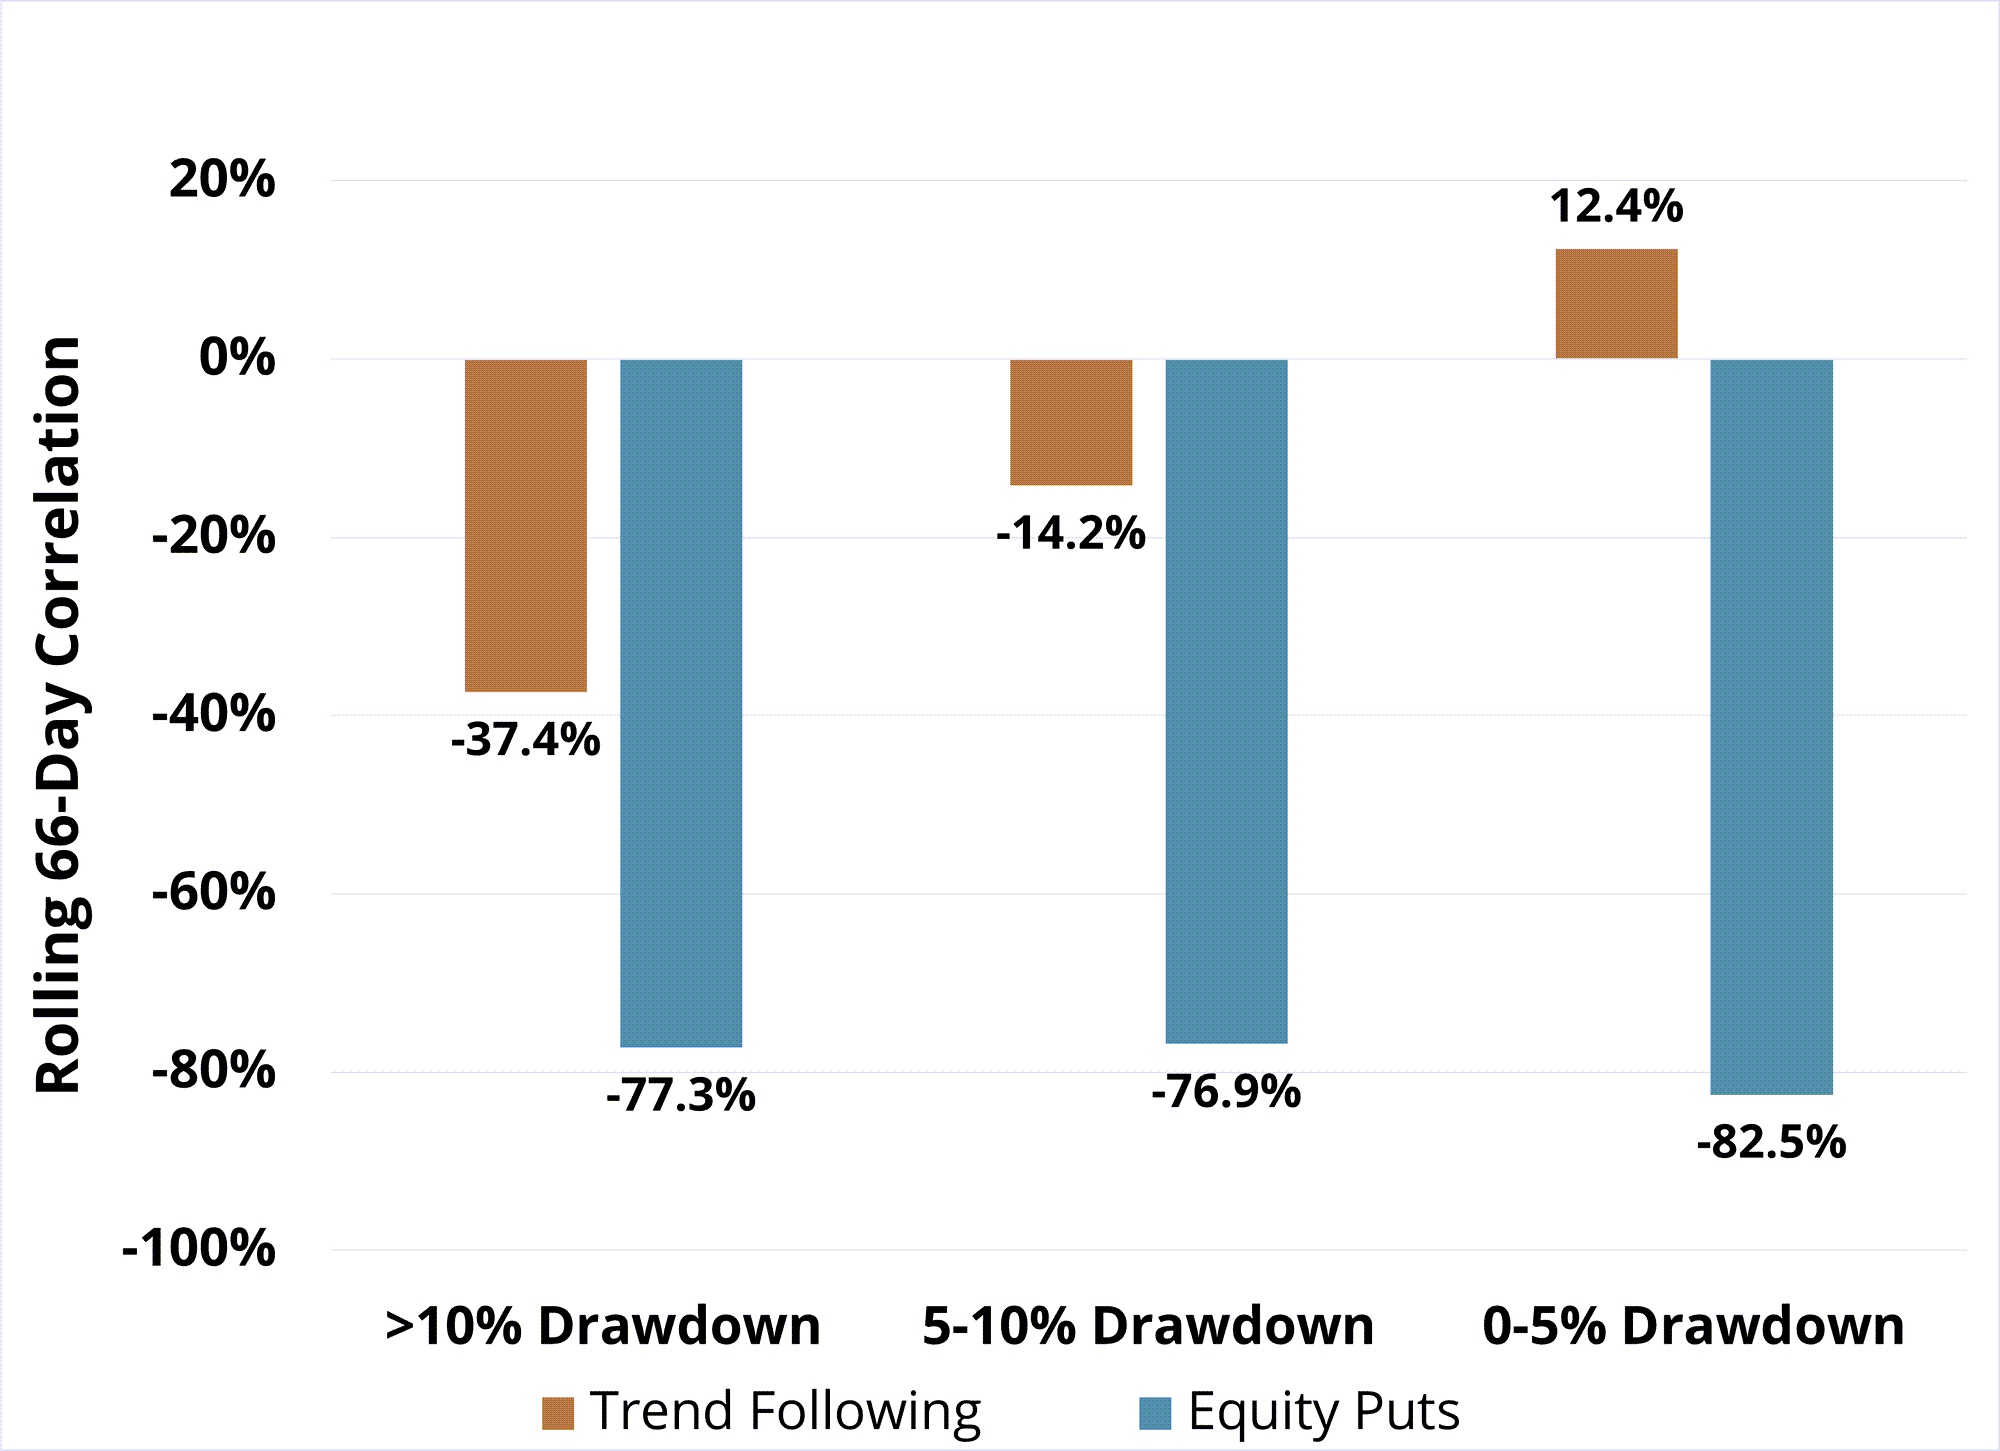
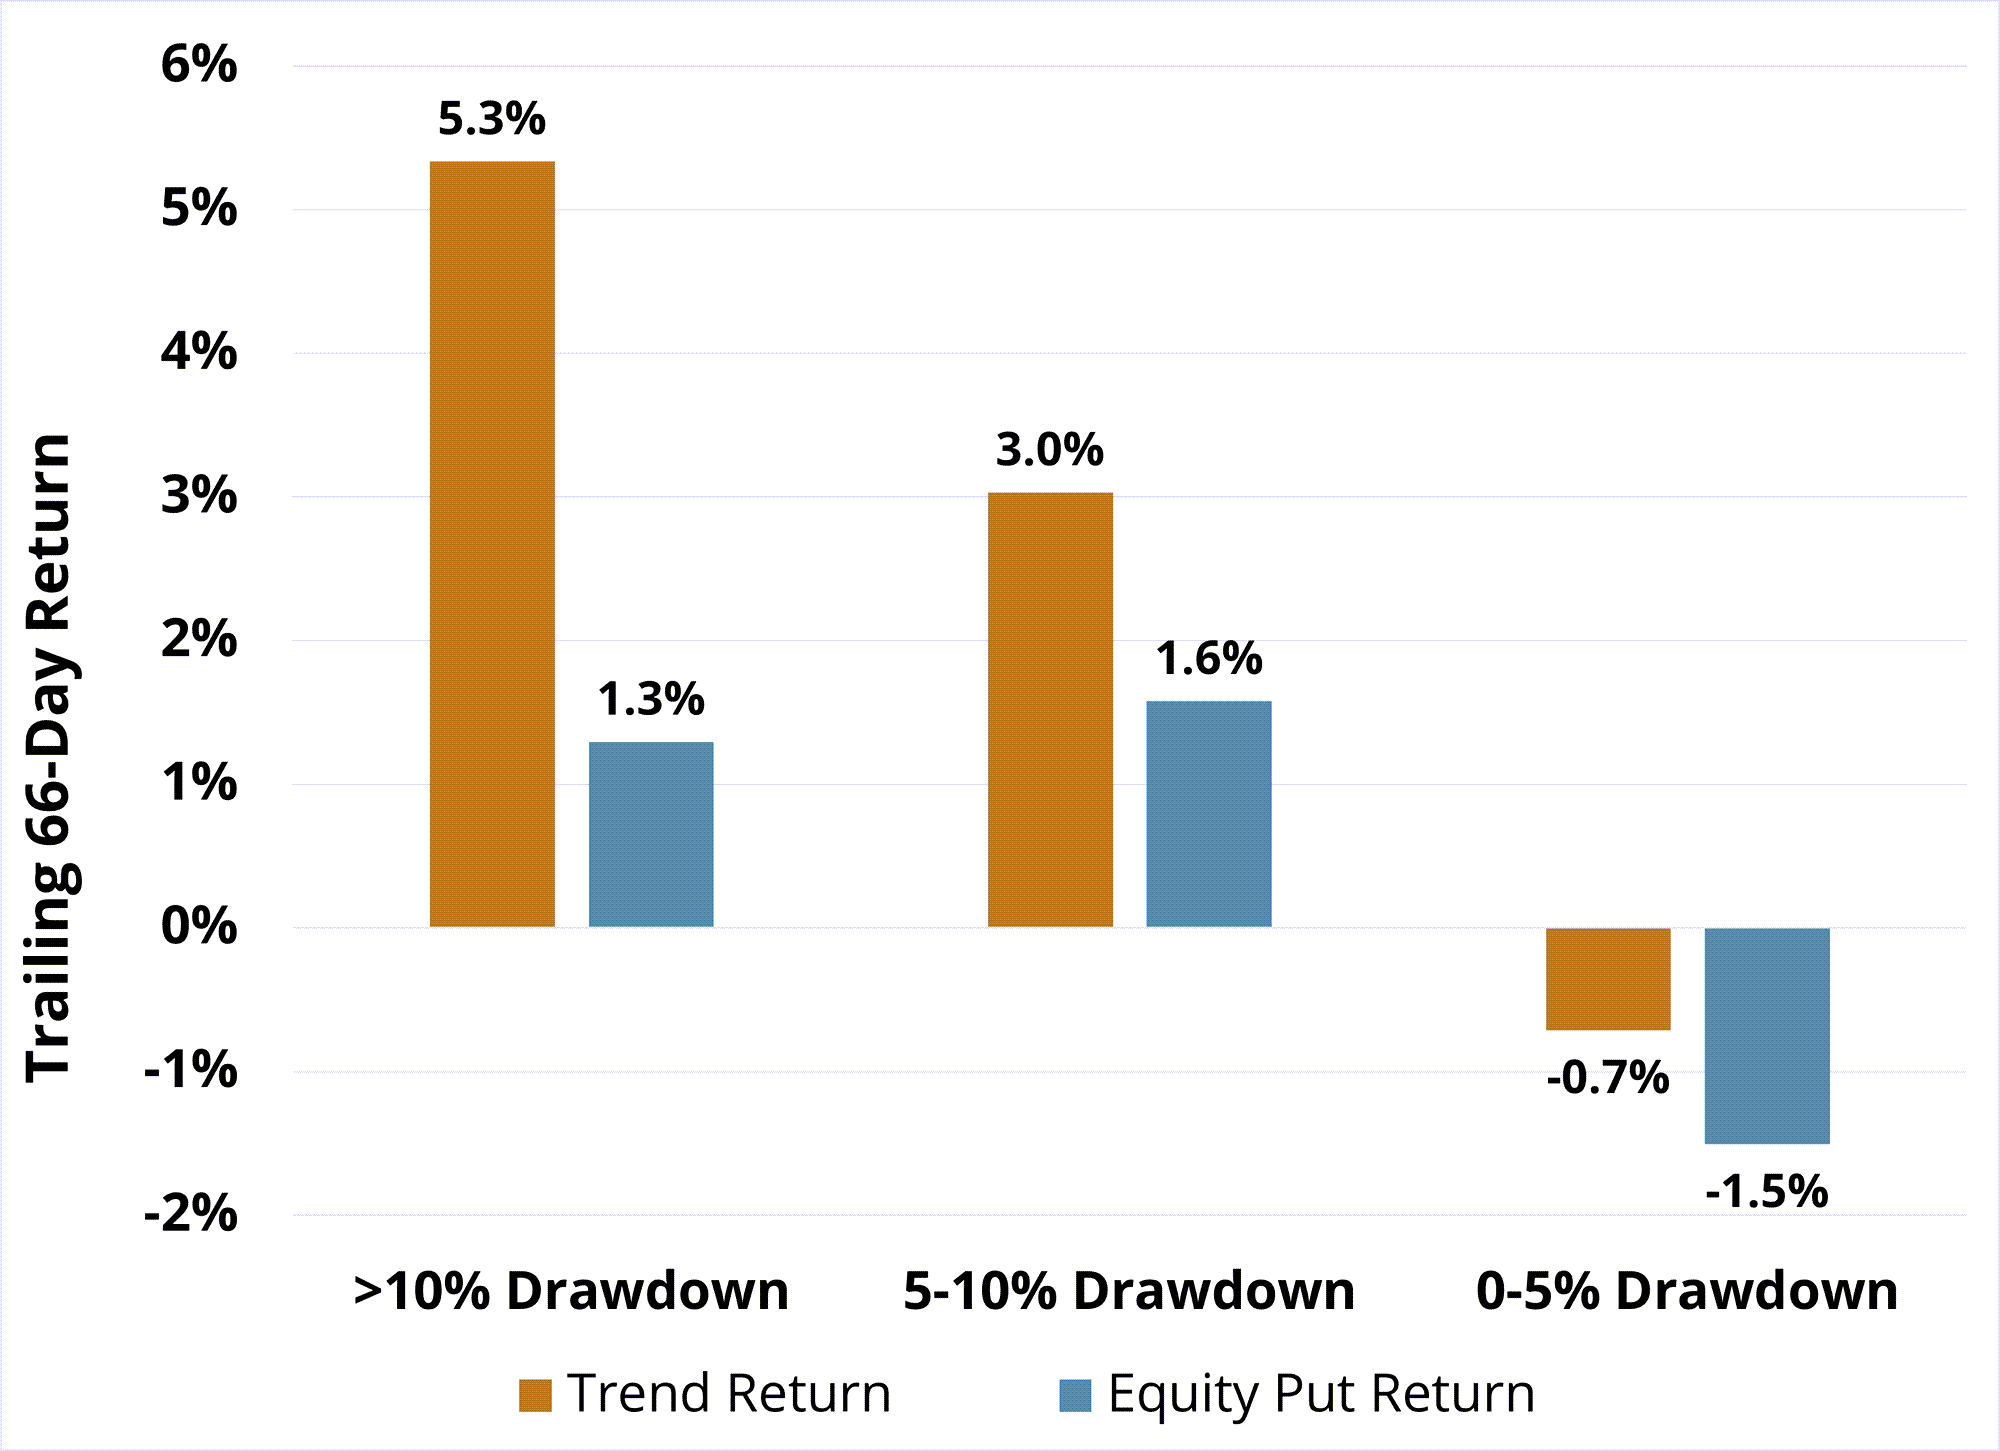
First, a note on what makes Trend-following, which is the primary driver of returns in managed futures, such a game-changer. Trend diversifies your portfolio with a unique convexity strategy. Unlike equity put options, which come with costly premiums and often underperform in choppy or sideways markets, trend strategies offer negative correlation AND increasing exposure (negative beta to the equity market) exactly when it is needed most—during deep market declines. Trend strategies act like an option, offering a hedge and “negative correlation when you need it” without the drag of high ongoing option premium costs, as shown in Figure 2 below.
Figure 2: Benchmark Trend Index Correlation and Returns vs. 60/40
Drawdown Periods: 04/30/07 - 08/31/24
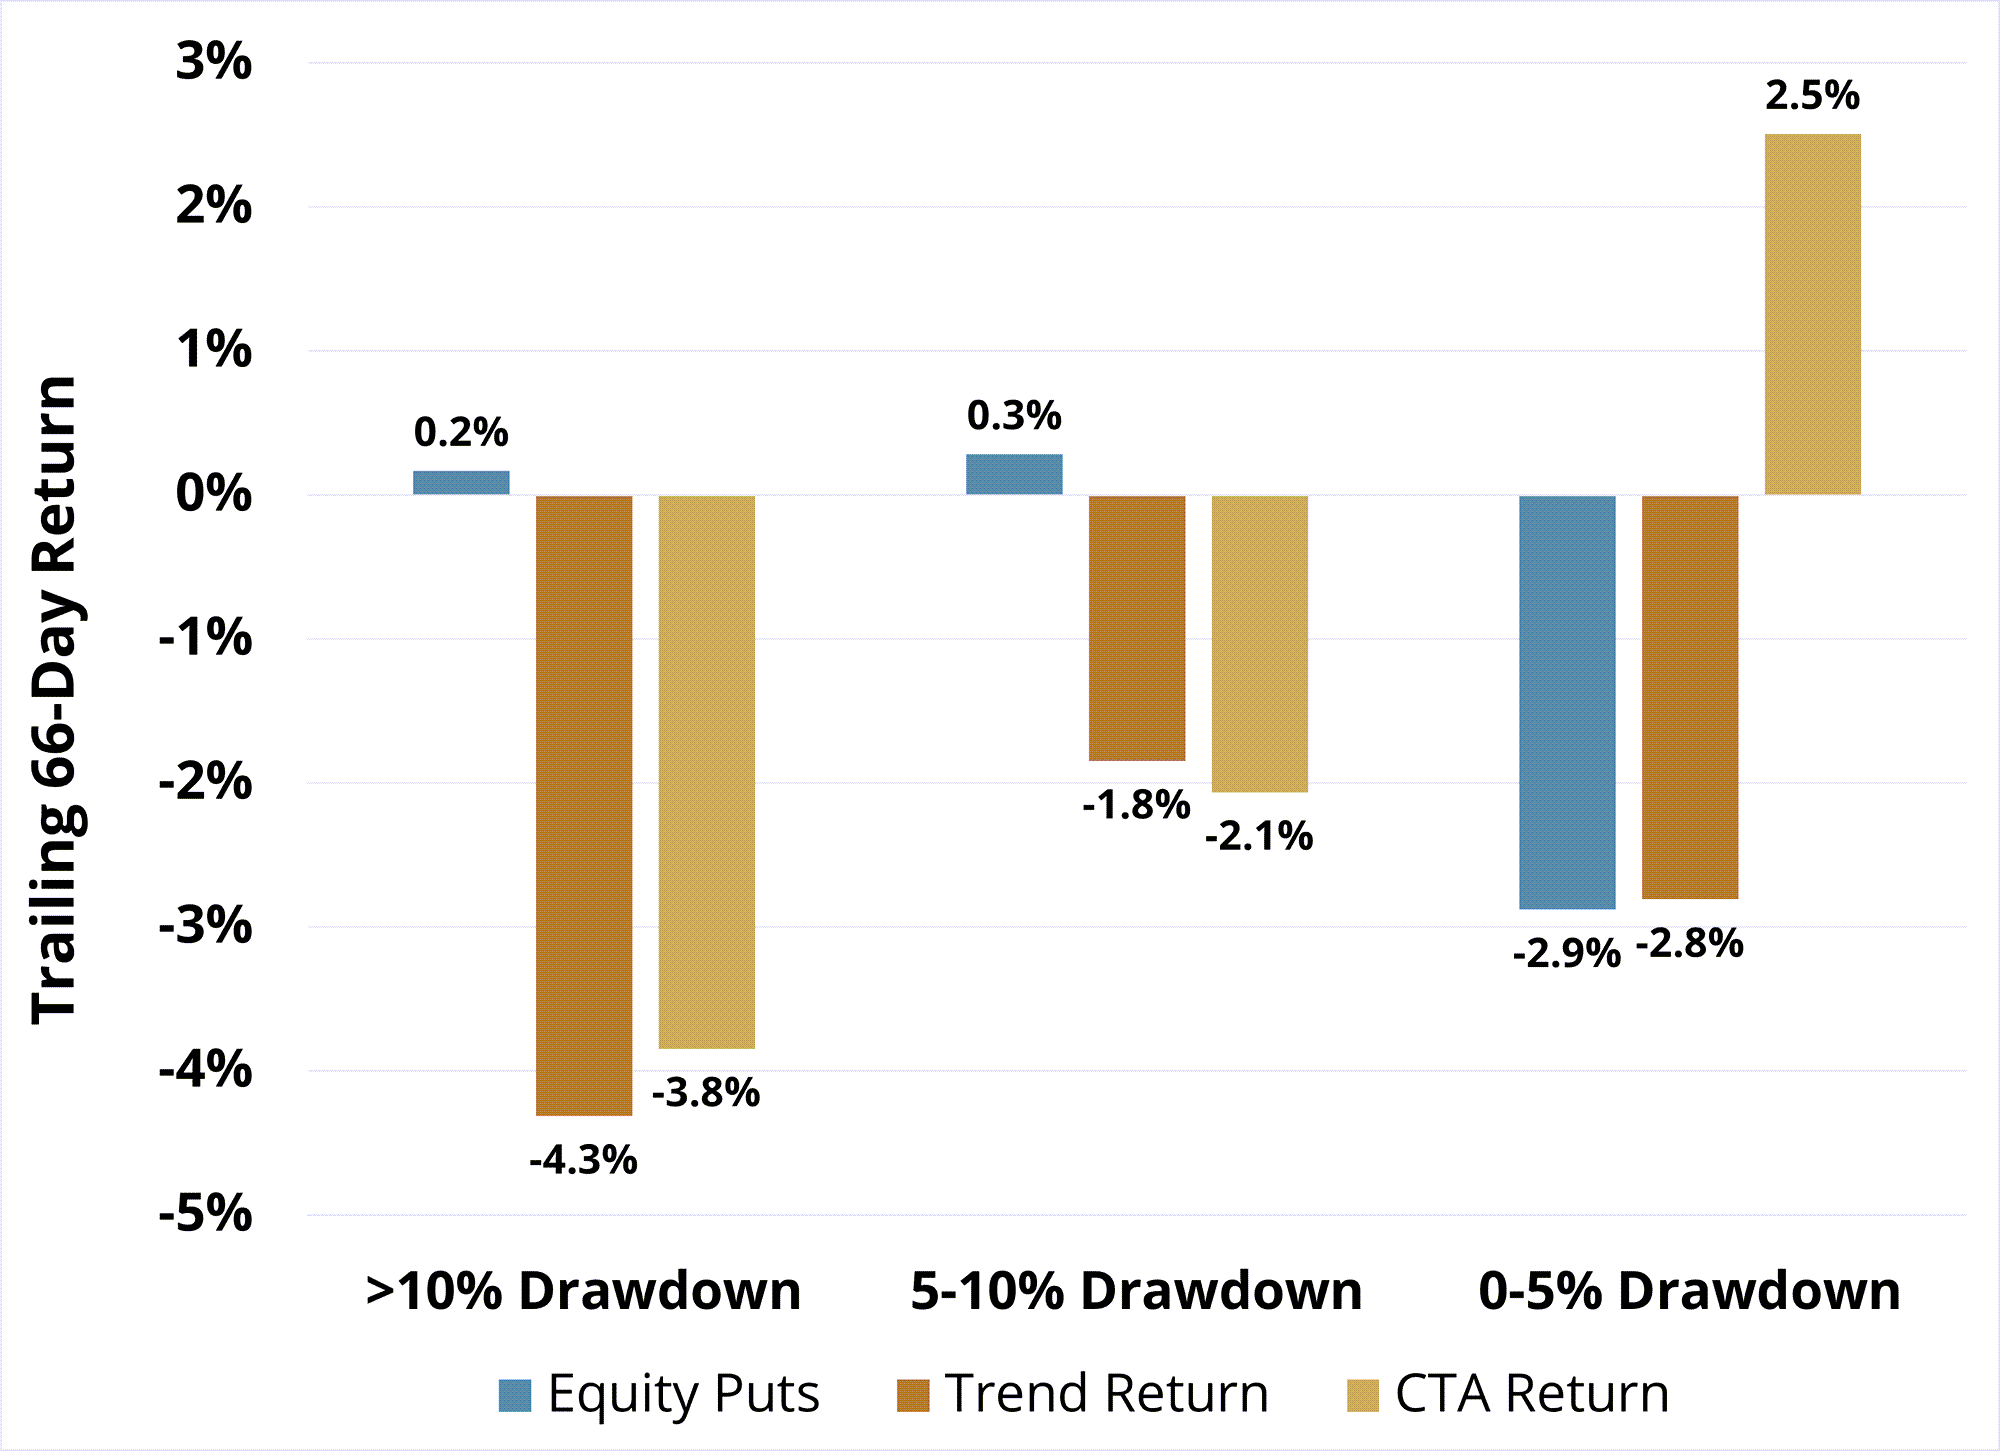
But also note that Trend-following is not a perfect solution. Indirect hedges (like Trend) will usually underperform direct hedges (equity puts) in sudden events, like the failure of Silicon Valley Bank in 2023 where Trend strategies might take more time to adjust to abrupt market events. This adjustment period is shown in the underperformance of the benchmark trend index and CTA versus equity put options in Figure 3 below.
Figure 3: CTA vs. Benchmark Trend Index vs. Equity Puts
Drawdown Periods: 03/08/22 - 08/31/24
All Other Times
But where do returns come from in more normal equity and rate markets, when a trend model is not generating convexity? Well, one can certainly have other assets trending while the core 60/40 is going about its normal course of business, e.g., CTA can trend follow in a large number of commodities. Another huge component of the strong absolute returns in CTA is the exploitation of structural carry opportunities across rate and commodity futures markets. Let’s dig into this feature a bit more now.
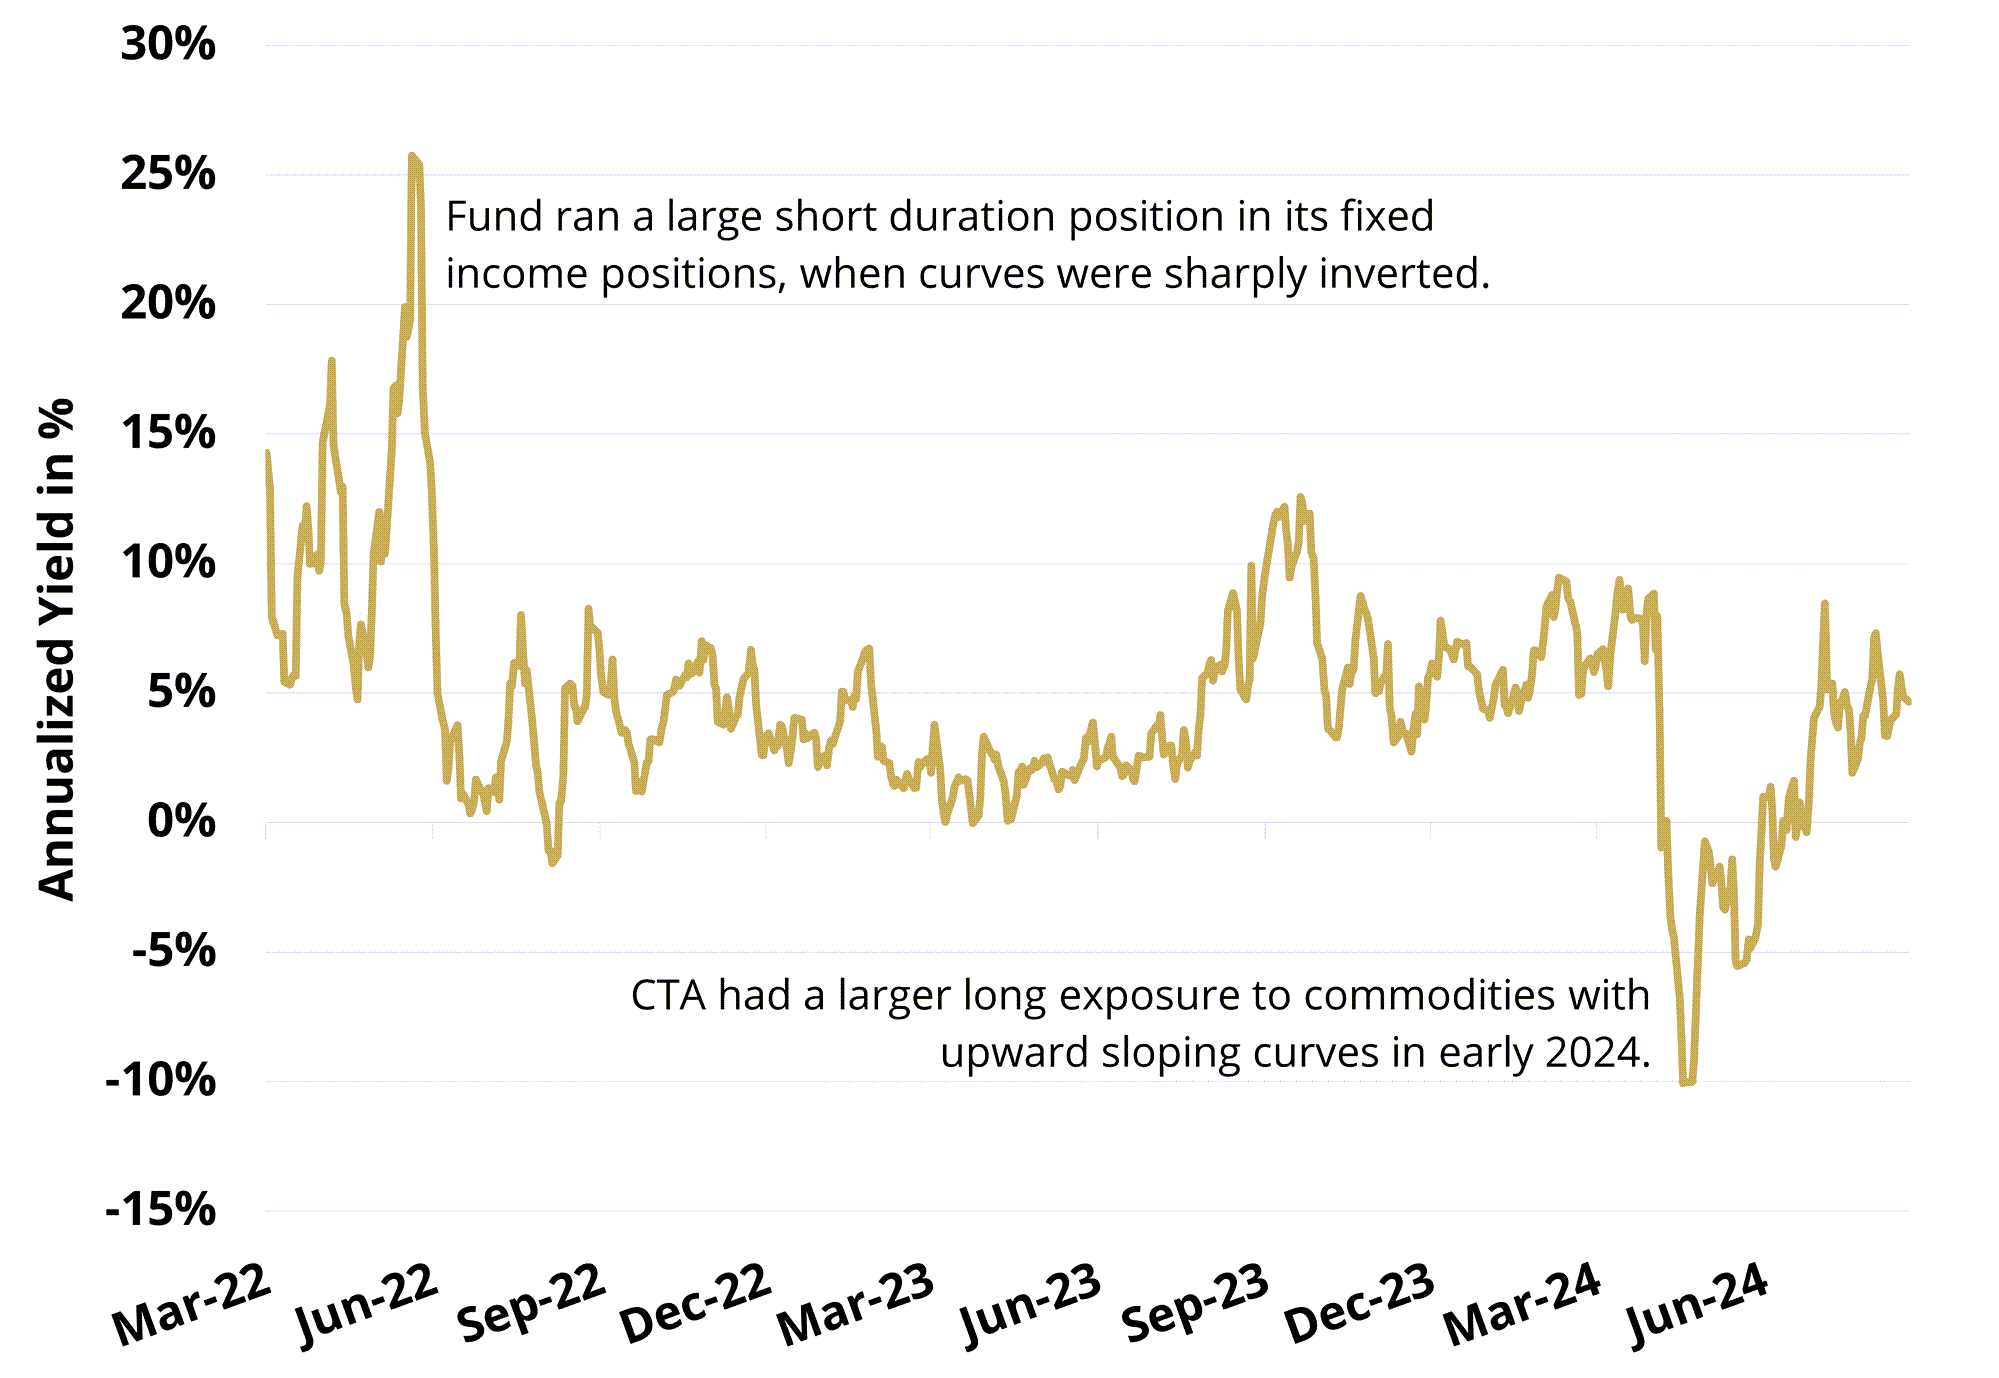
All futures markets have a “forward structure” with prices in the future either higher (referred to as Contango), flat (creatively called “flat”), or downward-sloping (“Backwardation”). The shape of the curve typically represents storage costs, financing costs, and sentiment; but these same factors can be used to generate income (“carry”). Additionally, sharply inverted yield curves can make long duration positions in bonds too expensive to hold while positioned for a decline in rates. CTA incorporates the curve shape in determining the trend and carry positioning biases.
This has been a critical driver of its outperformance. The chart below shows an estimate of fund annual carry or ‘yield’ over time (average 4.6%) and illustrates how active positioning across commodity and fixed-income curves adds to returns. From a return contribution standpoint, this was most evident since inception in the fund’s underweight position to the US yield curve front-end, where the sharp inversion and stubbornly high inflation prints made it very difficult for long positions in bonds to ‘beat the forwards’ and generate alpha.
Figure 4: CTA Carry Profile
03/08/22 - 08/31/24
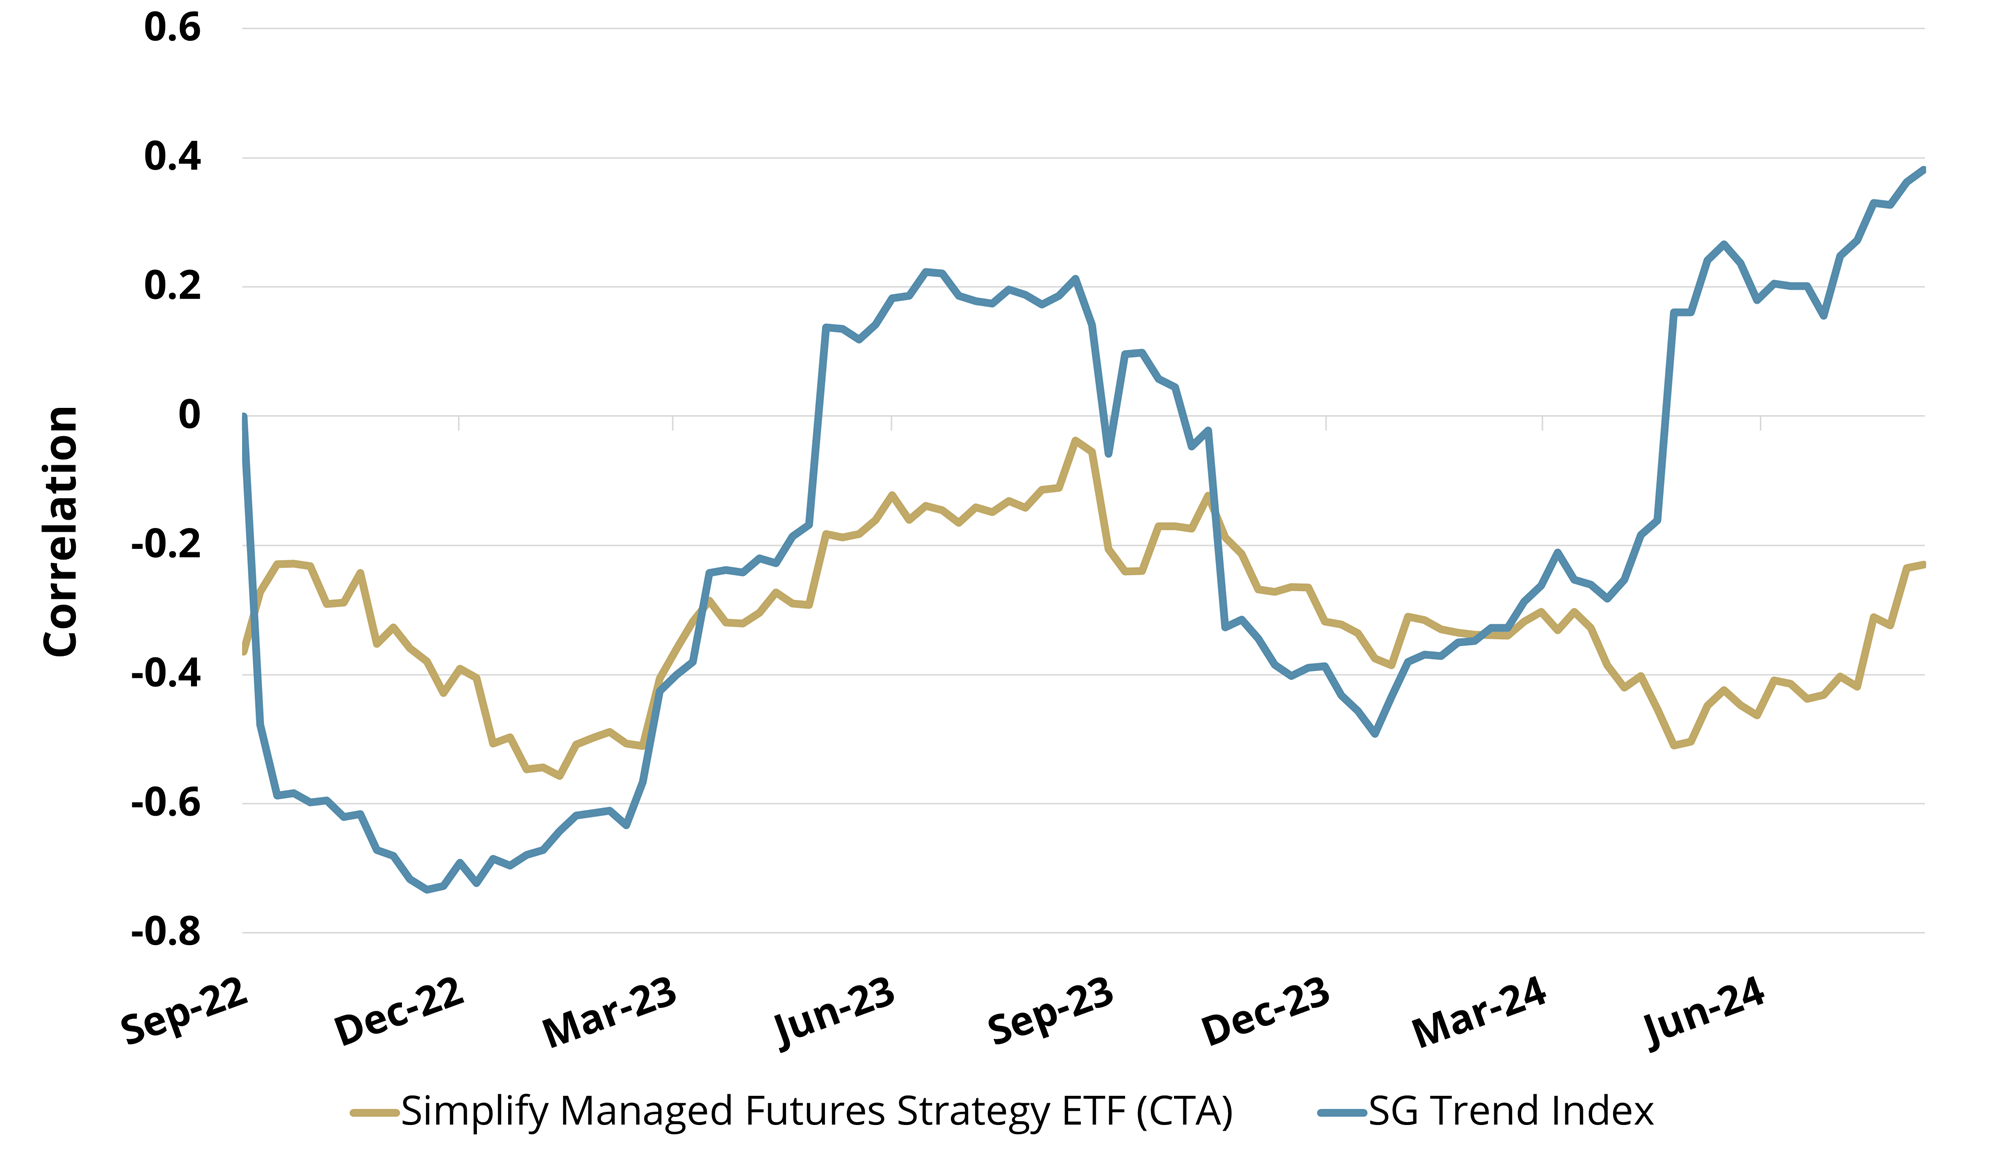
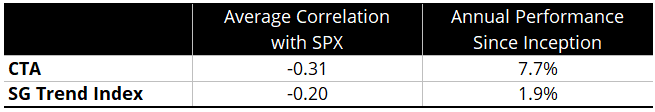
When combining the trend, fundamental reversion, and carry drivers of return in CTA, we see a formidable example of the benefits of low correlation to stocks alongside high annualized total returns, as displayed in Figure 5. Since its inception, CTA has averaged a -0.31 correlation to large cap stocks while displaying an annualized total return of 7.7%, making it a standout in terms of risk management and a constructive participant in both flat and trending markets. Contrast this with the broader trend benchmark, which has exhibited more variance in correlation and lower total returns due to its inclusion of equities and foreign currencies - two markets that CTA omits from its investable universe for this very reason.
Figure 5: CTA and Trend Benchmark Rolling Correlations vs. Equities
09/01/22 - 08/31/24
In Conclusion
By refining the trend following to exclude equities and foreign currencies, CTA improves upon trend-following’s defining feature: low-cost negative correlation to equity markets when needed and positive convexity in the return profile. By pairing this potential protection with a carry strategy that can offer positive returns in various market scenarios, the Simplify Managed Futures Strategy ETF has delivered high annualized returns while diversifying traditional portfolios, making it a “Hedge You Get Paid to Own.”