Equity
Equity
A Better 60/40? The Case for Collars
Share

Introduction
In this write-up, we present hedged equity as an alternative to the traditional 60/40 stock vs. bond portfolio. We describe the core scenarios where this approach is expected to outperform and compare the hedged equity approach (put purchase funded by a covered call sell) to the Buffered approach (which protects the investor from excessive stock market selloffs) in the Appendix.
The Case for a Put Spread Collar Strategy
Investors rely on the negative correlation between stocks and bonds to mitigate losses under the expectation that yields and spreads will decline on slower growth and easier monetary policy. In recent cycles, the FED’s quantitative easing and bond purchases added a further tailwind to bonds’ advantage, as liquidity programs bought spread products (i.e., mortgages and corporates) and kept spreads tighter than otherwise.
Since late 2021, however, poor bond performance has prompted investor questions – could there be a better implementation, for both long and short-term horizons? Below, we present three cases in favor of hedged equity using put spread collars (referred to below as simply “hedged equity”, see end for comparison of this and Buffer strategies).
Case 1 (Long-Term): Secular Rise in Yields
The initial response to widening fiscal deficits and levels of debt was for global central banks to monetize debt via quantitative easing (perhaps grounded in Modern Monetary Theory), but the inevitable downside was excessive inflation and higher yields, exacerbated by the pandemic recovery.
Because negative correlation has been the primary rationale for a 60/40 composition, the concern is an extended phase where positive correlation persists. During the most recent cycle, deviations from the typical relationship and the post-pandemic inflationary shock left bond investors smarting from sharply higher interest rates and wider spreads. A hedged equity with costless (at initiation) collar approach like that we outline below capitalizes on extended periods of positive stock and bond correlation, especially when both decline in value.
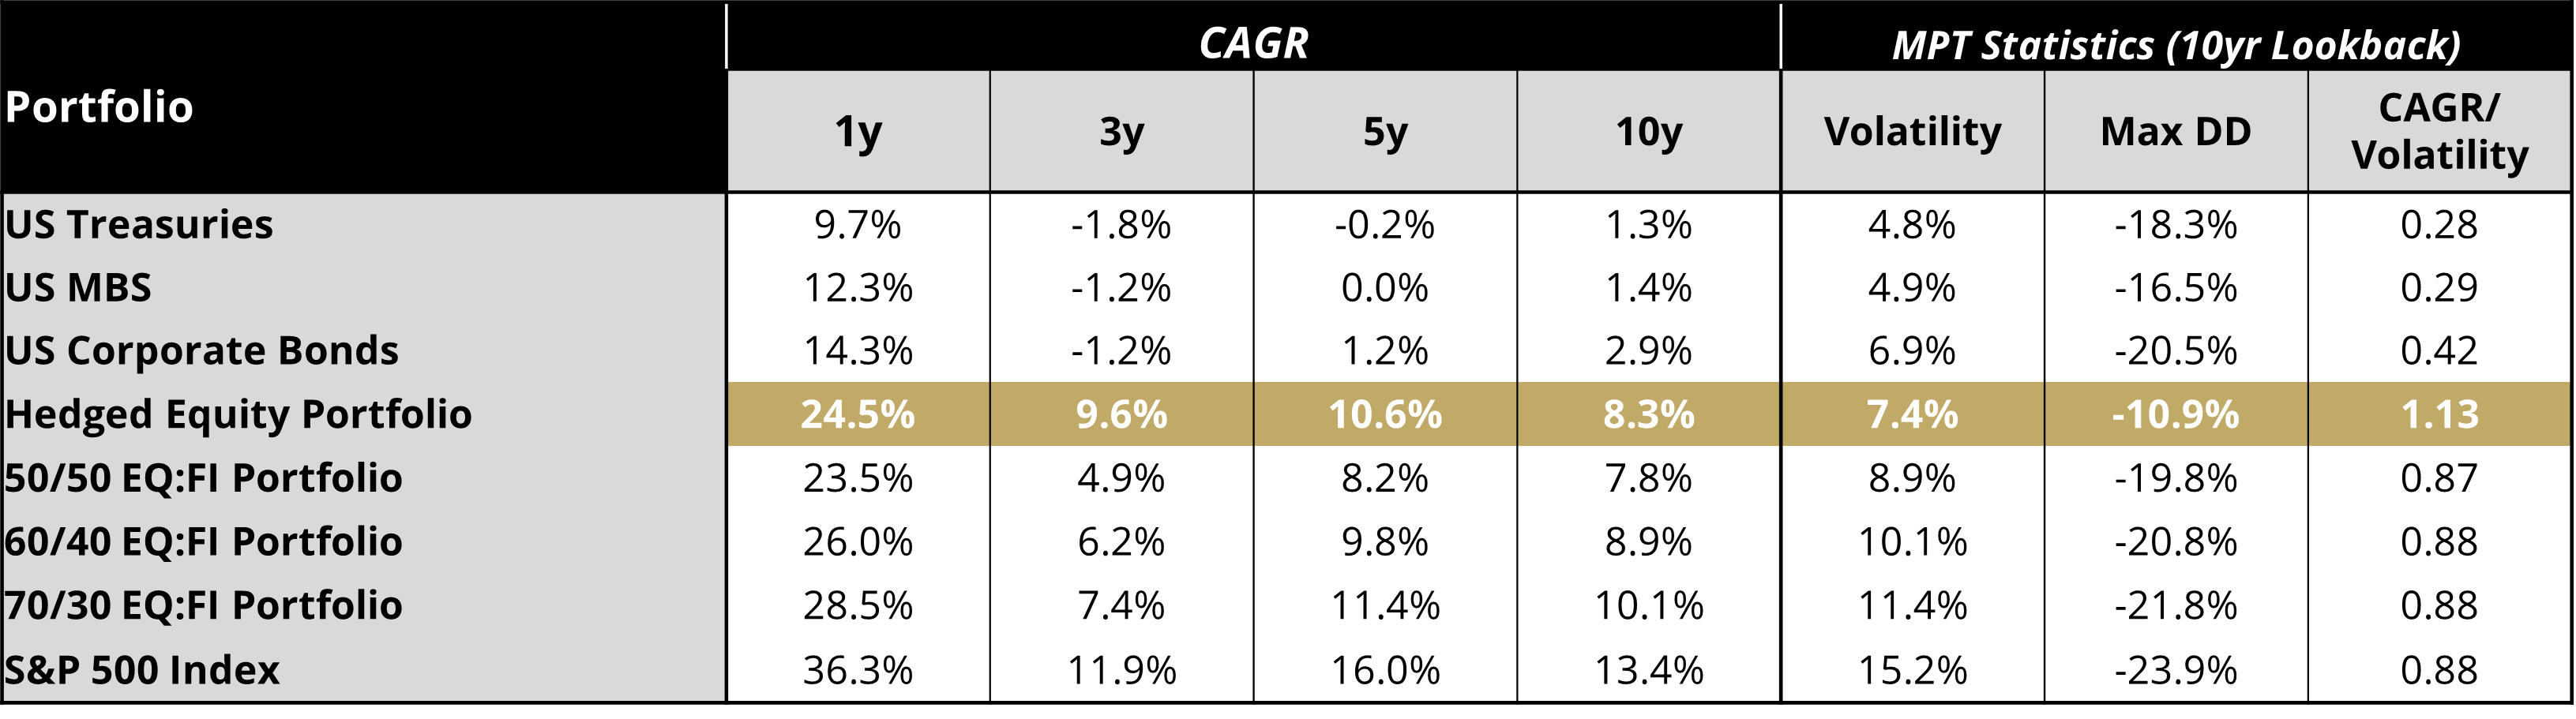
Another advantage of a hedged equity approach over a blended portfolio is that it can remove the challenge of selecting the optimal target bond allocation percentage. A sample hedged equity index total return as shown in Table 1 has outperformed nearly all of the blended portfolios in the last 5 years (having only lagged 70/30 at the 5-year point). More importantly, a hedged equity portfolio has had better risk-adjusted returns than any combination of equities and bonds including sector returns over the last 10 years, with lower volatility and a smaller maximum drawdown.
Table 1 - Historical Return and Volatility Comparison
Case 2: Cyclical/Tactical Factors, Including Wider Spreads
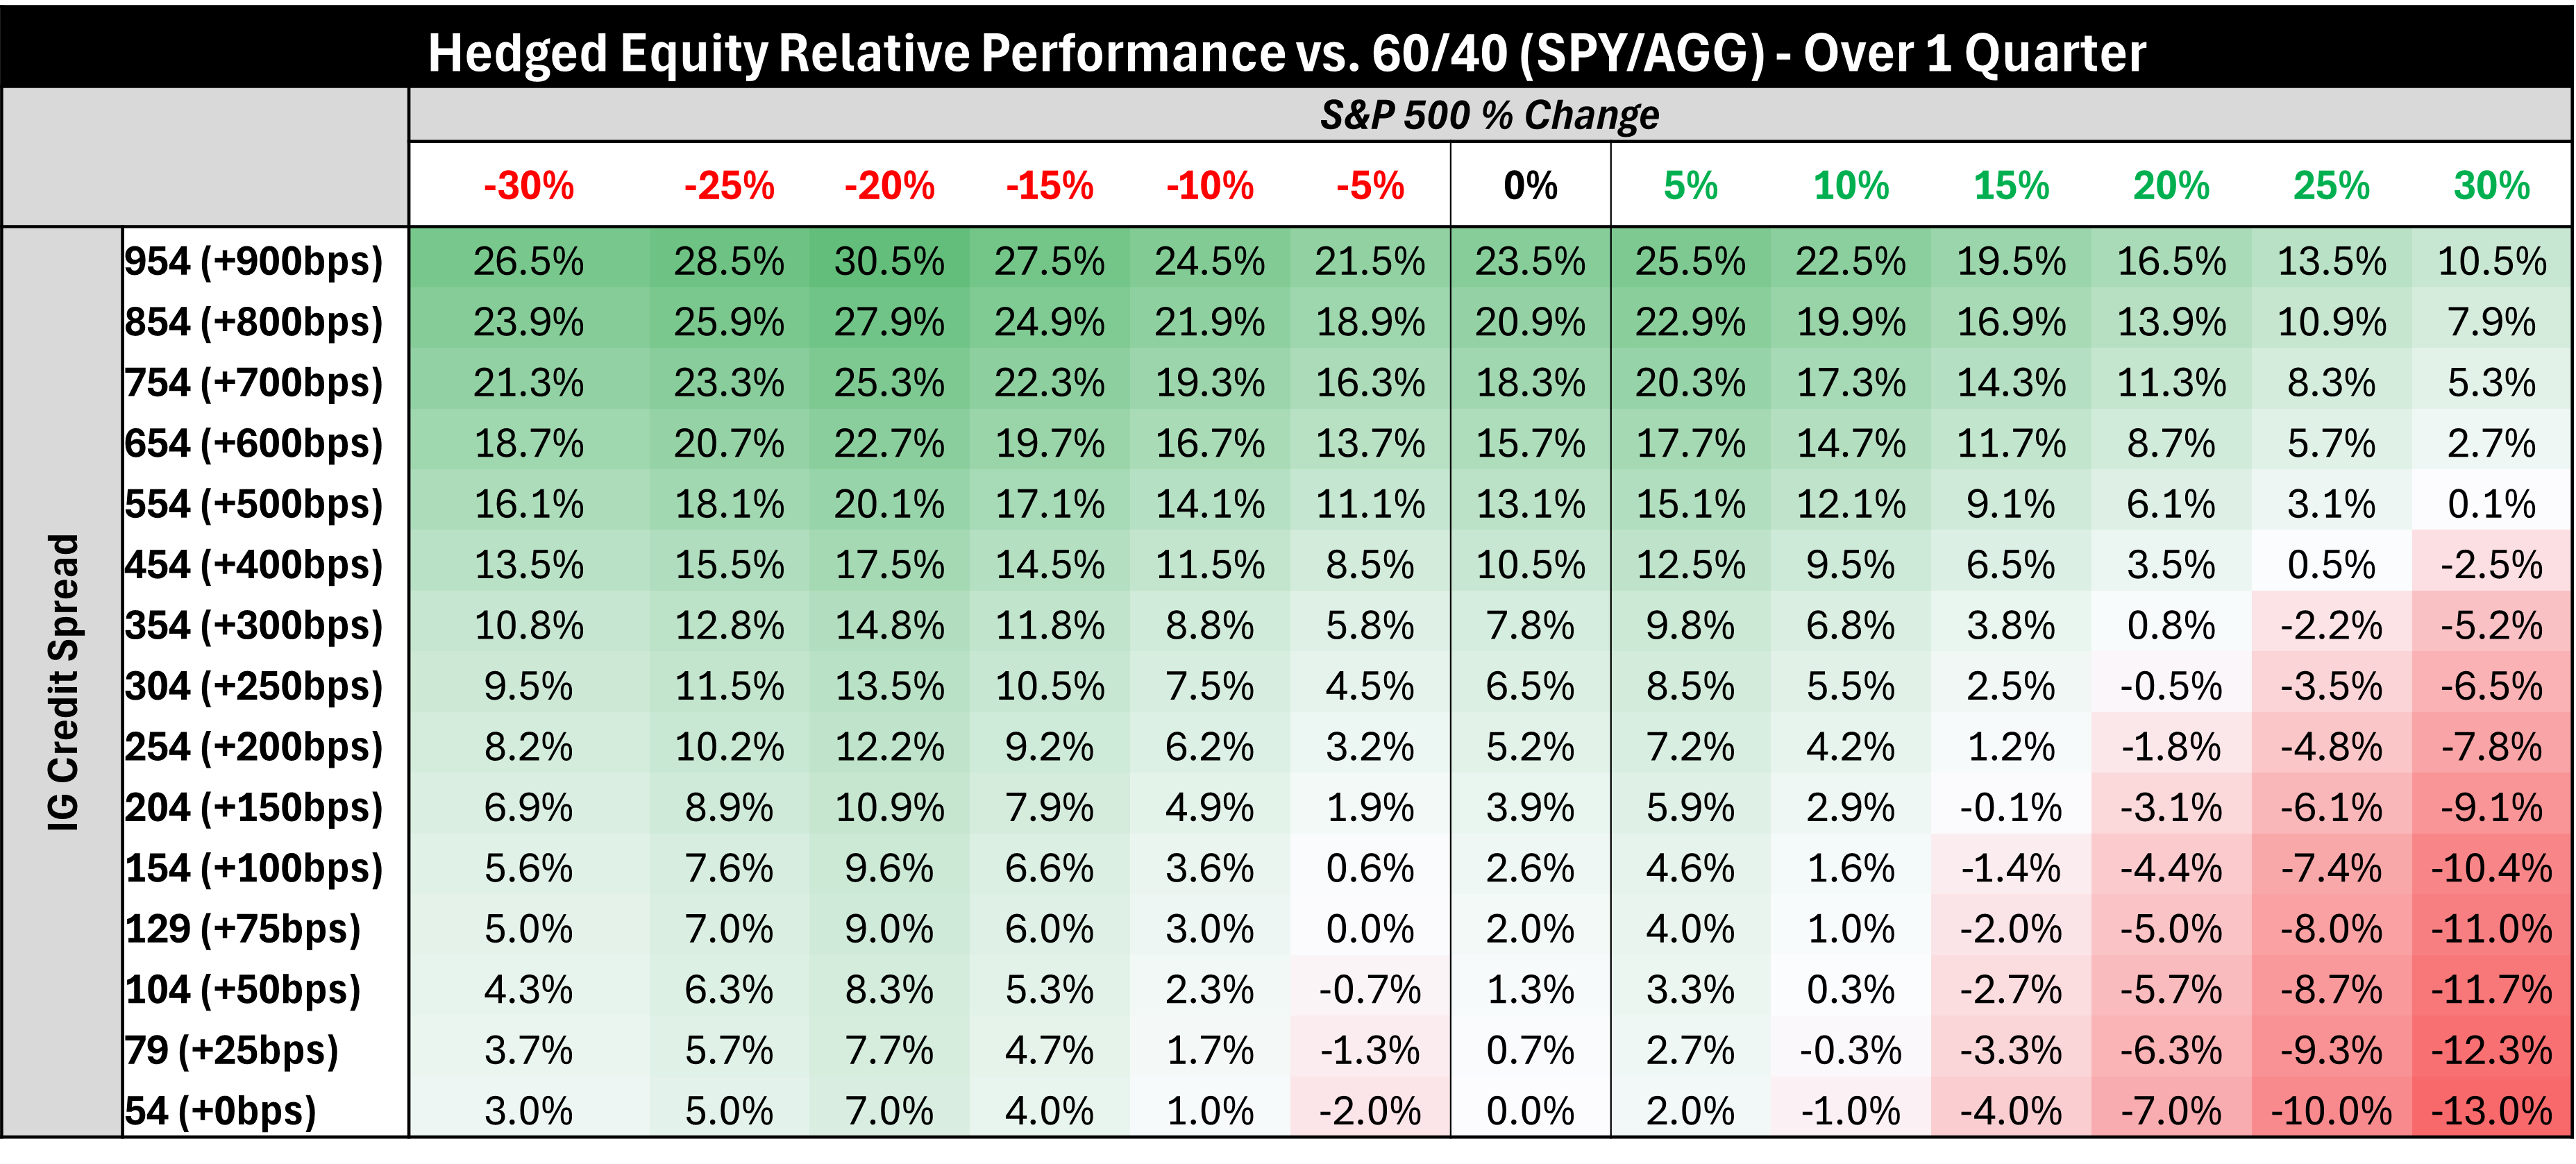
Over a cyclical (medium-term) time frame, there is further rationale for a portfolio allocation with stocks and a put spread collar. Wider corporate and Mortgage-Backed Securities (MBS) sector spreads can significantly reduce returns in an aggregate bond portfolio. Table 2 illustrates the hypothetical impact of spread widening on the relative outperformance of a hedged equity strategy vs. the 60/40 portfolio. With investment grade corporate spreads at a historically tight +51bp level, widening from here suggests broader fixed income underperformance vs. a put spread collar portfolio.
Table 2: Sample Spread Shock vs. Projected Hedged Equity Returns
Case 3: Higher Equity Volatility and Demand for Calls
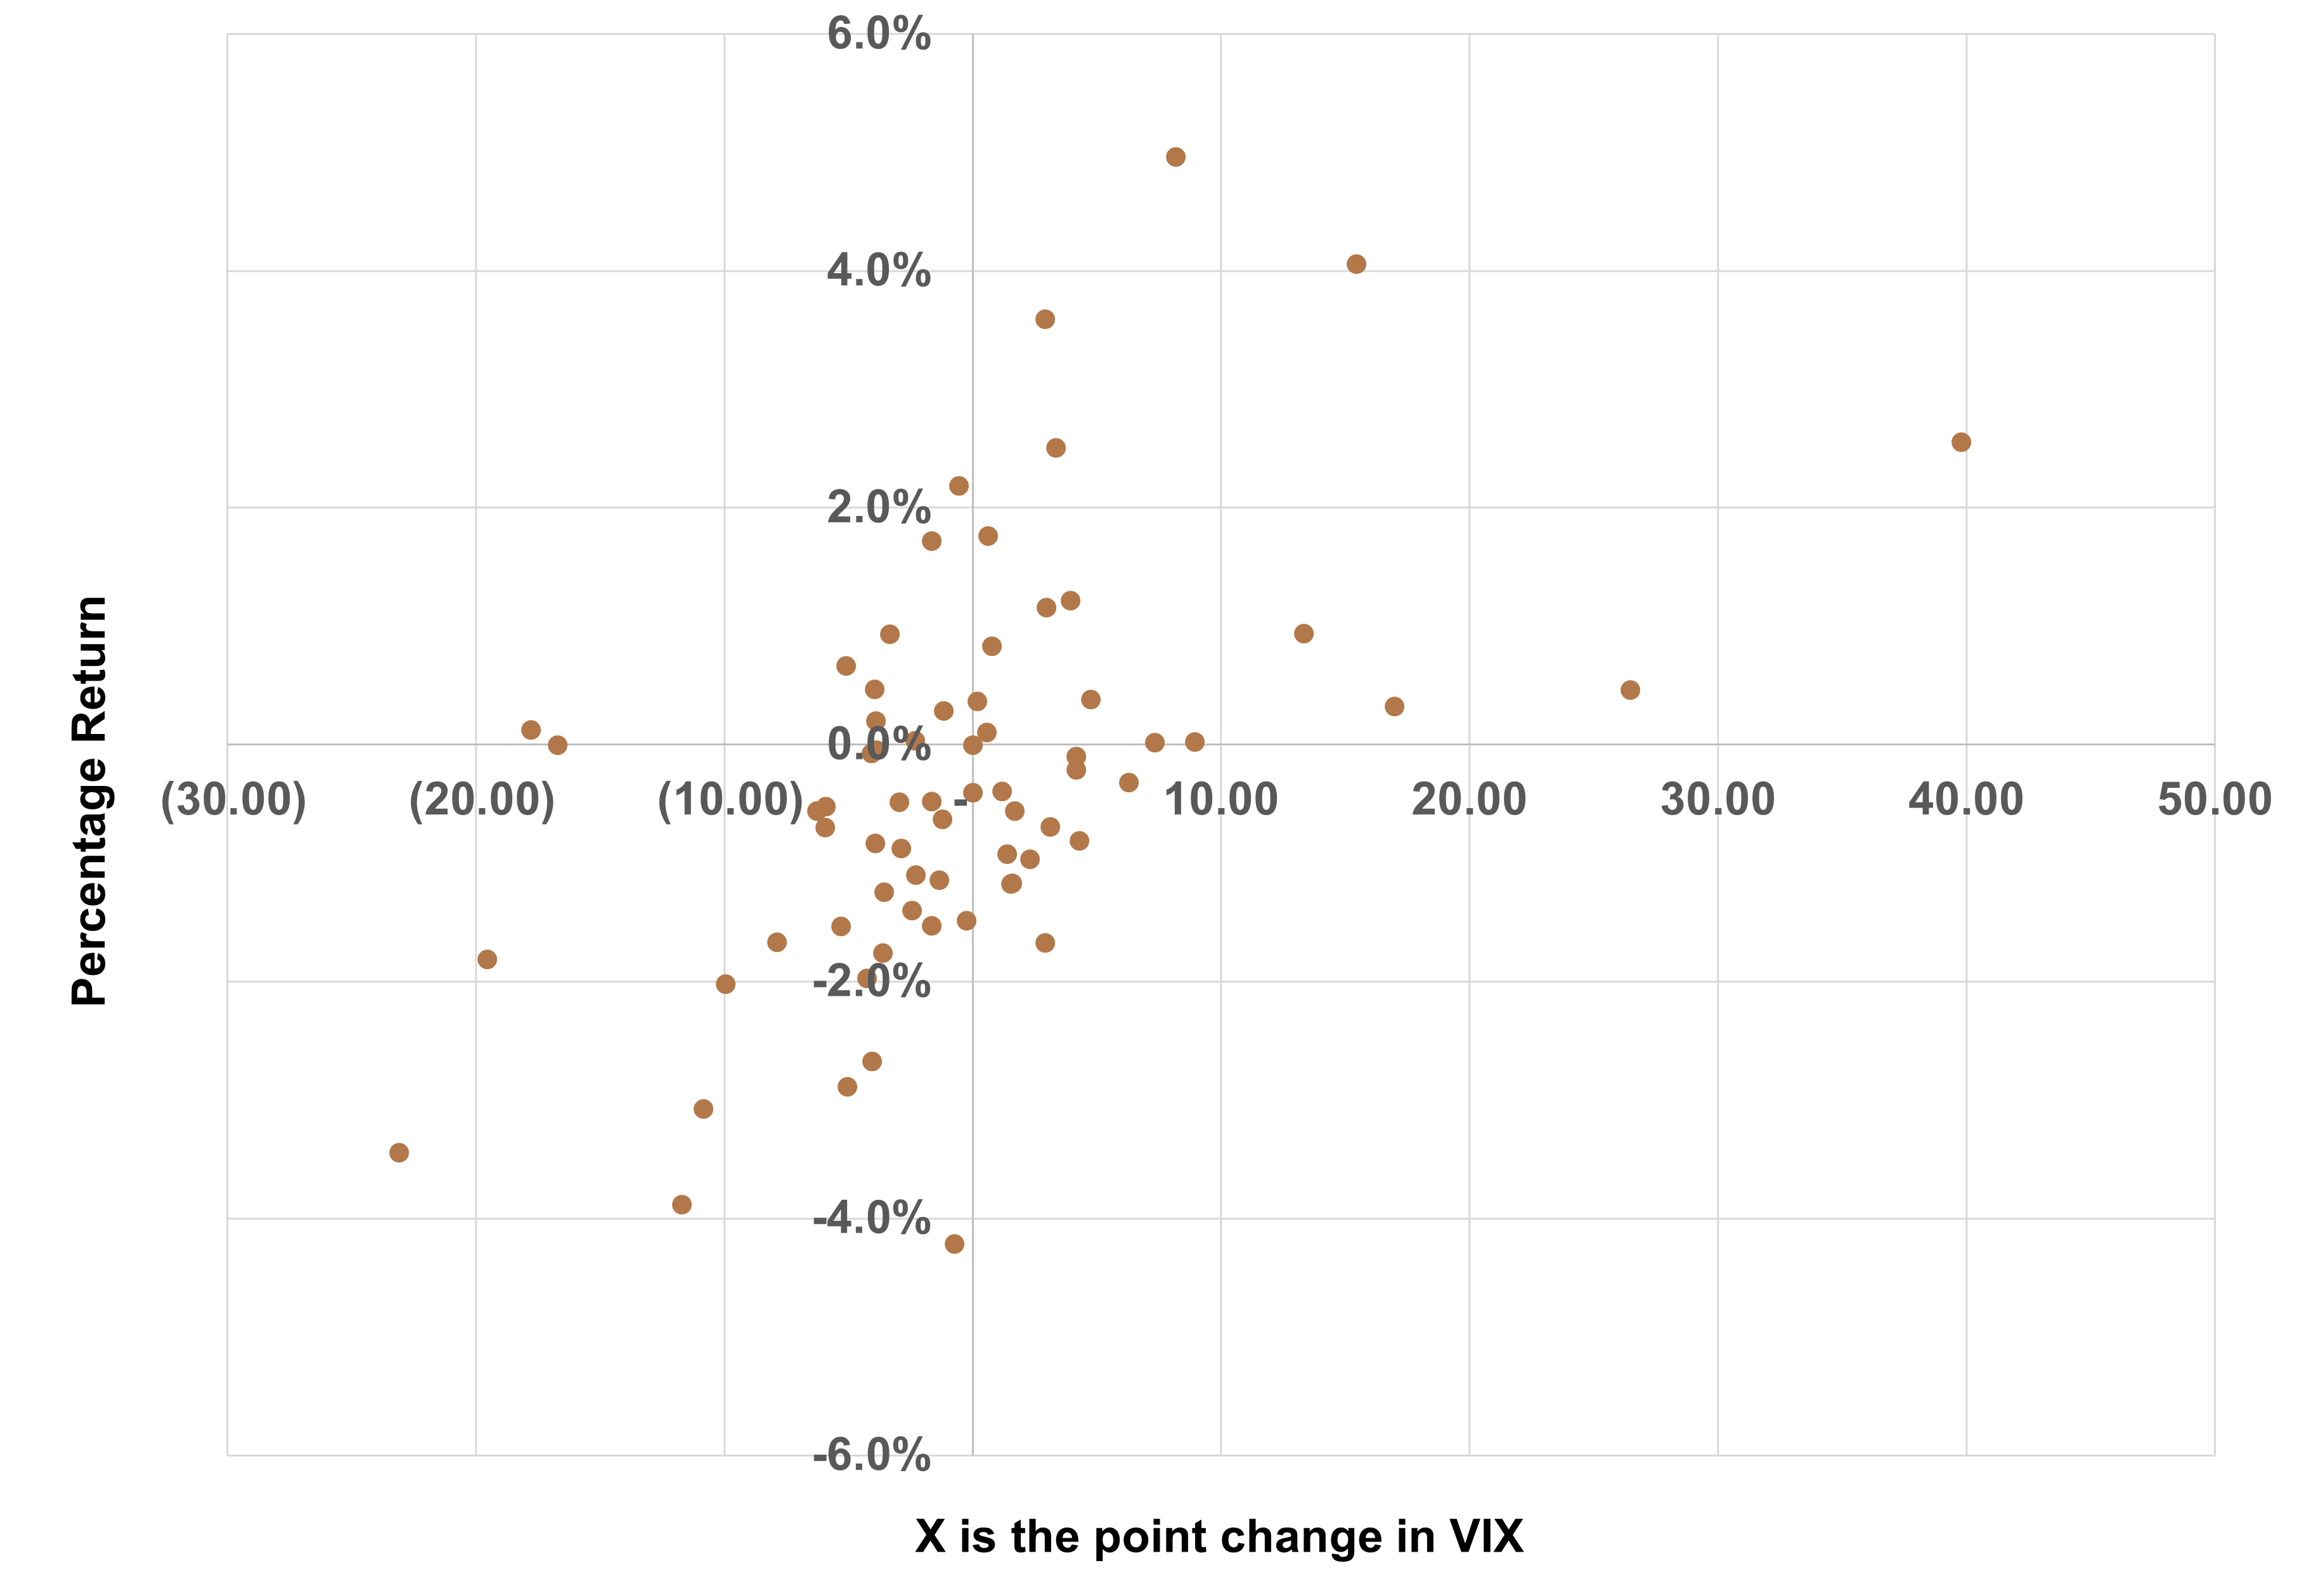
Another effect we believe will benefit collar strategies looking forward is the potential for cyclically higher equity volatility (as measured by VIX). The chart below shows quarterly change in VIX points on the horizontal axis and the percent outperformance of a hedged equity portfolio. When we observe quarterly VIX increases above 8 points, a hedged equity approach has consistently beaten the 60/40 blend. Also, for smaller VIX increases the skew of the distribution (not necessarily the frequency) favors hedged equity as well.
Finally, there is a microstructure condition in the options market which makes hedged equity attractive. Due to investor demand for market upside, the concentration of mega-cap stocks to the broad index level, and investor interest in stock replacement trades (switching delta), the relative richness of Index calls relative to puts have call strike moneyness on the regular monthly roll has been above 5%. The relative cheapness of puts to calls in the 1-3 month maturity makes costless collars an effective defensive alternative for a correction in stocks.
Figure 1: Hedged Equity Outperformance Over 60/40 vs.
VIX Quarterly Change
Summary
Option collars as part of a hedged equity strategy are a powerful replacement for a conventional 60/40 portfolio. These are often compared to buffered strategies but hedged equity offers less specificity of attachment points of the options and max loss.
Our view is that a put spread collar such as that in a hedged equity strategy offers investors the ability to outperform in the event of higher yields, wider spreads, and higher equity volatility/VIX shocks. Whether an investor’s horizon is long-term, medium, or short-term, those with a view that yields or spreads will rise or widen should consider an implementation which is liquid and reduces the burden of determining what percentage of bonds to hold in a diversified portfolio.
Appendix
In this appendix, we compare and contrast hedged equity to buffer solutions as a replacement for the 60/40.
HEDGED EQUITY ETFS
Objective: Hedged equity ETFs aim to provide exposure to equity markets while offering some downside protection. They may also use leverage or other strategies to enhance returns or further protect against losses.
Strategy: These ETFs typically employ a variety of hedging techniques, such as options, futures contracts, or short positions. By doing so, they can offset potential losses in falling markets. For example, they may short certain stocks or sectors, buy put options, or invest in inverse ETFs.
Risk/Return Profile: Hedge equity ETFs can potentially limit losses during market downturns, but they might also cap upside gains due to the cost and structure of the hedging strategies. This makes them less volatile than traditional equity ETFs, though they tend to underperform in strong bull markets.
BUFFER ETFS
Objective: Buffer ETFs aim to protect against a specific percentage of losses while allowing for capped upside gains. They’re designed for investors who want a defined level of protection against market downturns within a certain range, which is often set as part of the ETF's structure.
Strategy: These ETFs typically use options to create a “buffer zone,” which protects against losses up to a specified percentage (e.g., 10-20%). However, they also cap the upside potential to balance out the cost of the downside protection. The buffer and cap are predefined and usually reset on an annual basis.
Risk/Return Profile: Buffer ETFs are often favored by more conservative investors. They offer some downside protection but don’t completely eliminate losses and can underperform in bull markets due to the cap on gains.
KEY DIFFERENCES
Downside Protection: Hedged equity ETFs often provide more flexible or variable protection strategies, while buffer ETFs offer a clearly defined buffer range (such as protection up to the first 10% or 15% of losses).
Upside Potential: Hedge equity ETFs may offer more upside potential than buffer ETFs, which typically have a fixed cap on gains.
Complexity and Transparency: Buffer ETFs are usually more transparent in terms of the range of losses they protect against and the cap on gains. Hedge equity ETFs might employ more complex strategies that can be less predictable.
WHICH TO CHOOSE?
Buffer ETFs may suit investors who want defined protection within a specific range and don’t mind the trade-off of a capped upside.
Hedged Equity ETFs might be more appropriate for those seeking flexible protection with potentially more room for gains, though with increased complexity and variability in performance.
Both options can serve as valuable tools for managing risk in a portfolio, depending on your investment goals and risk tolerance.
GLOSSARY
Collar: An options strategy that involves buying a downside put and selling an upside call that is implemented to protect against large losses, but that also limits large upside gains.
Costless Collar: A form of options collar strategy that limits your losses. To execute it, you sell a short call option and buy a long put option whose prices cancel each other out.
Delta: Measures the degree to which an option is exposed to shifts in the price of the underlying asset (i.e., a stock) or commodity (i.e., a futures contract).
Moneyness: Describes the intrinsic value of an option's premium in the market. A contract is either “in the money”, “out of the money”, or “at the money”. A call option is said to be “in the money” when the future contract price is above the strike price. A call option is “out of the money” when the future contract price is below the strike price.
Mortgage-Backed Securities (MBS): Investment products similar to bonds. Each MBS consists of a bundle of home loans and other real estate debt bought from the banks that issued them. Investors in mortgage-backed securities receive periodic payments similar to bond coupon payments.
Option: An option is a contract that gives the buyer the right to either buy (in the case of a call option) or sell (in the case of a put option) an underlying asset at a pre-determined price ("strike") by a specific date ("expiry"). An "outright" is another name for a single option leg. A "spread" is when options are bought at one strike and an equal amount of options are sold at a different strike, all at the same expiry.
Quantitative Easing: A form of monetary policy in which a central bank, like the U.S. Federal Reserve, purchases securities in the open market to reduce interest rates and increase the money supply.
Risk-Adjusted Return: A calculation of the profit or potential profit from an investment that considers the degree of risk that must be accepted to achieve it. The risk is measured in comparison to that of a virtually risk-free investment—usually U.S. Treasuries.
Spread: The difference or gap between two prices, rates, or yields.
Spread Collar: A strategy that involves buying a downside put and selling an upside call that is implemented to protect against large losses, but that also limits large upside gains.
VIX Index: A real-time market index representing the market's expectations for volatility over the coming 30 days.