Share
Introduction
Investors in recent years may be justified in wondering whether their fixed income allocations are worthwhile. In contrast to the stout returns leading up to the pandemic, more recent results have seemed lackluster. Moreover, the diversification benefit ascribed to the classic 60/40 mix has been eroded by the recent rise in correlation with equities.
The solution is embracing a strategy that is willing to go out-of-benchmark and across sectors within fixed income. The Simplify Opportunistic Income ETF (CRDT) takes exactly this type of highly active approach to fixed income investing. In contrast to many bond funds that maintain fairly static or fixed (pun intended) positions that mimic their benchmarks, CRDT aims to invest where there is value. In so doing, it seeks to generate income and return and can play a pivotal role as part of a well-diversified overall portfolio. Its value proposition is reflected in the solid performance numbers it has put up since its inception.
Truth in Advertising, Bond Fund Style
Bond funds tend to convey what investors should expect from them in two ways. The first is through their name: a fund called the “Hotshot High Yield Fund” should hold mostly bonds from sub-investment grade issuers.1 The second way this can be communicated is through the manager’s benchmark selection. An appropriate bogey allows investors to gauge the success of the fund through alpha (assuming the fund is actively managed), how much risk the manager is taking to achieve those excess returns through tracking error, and even how the fund is doing relative to competitors who utilize the same performance yardstick.
A fund’s name and benchmark can also provide signposts for investors looking to shift their exposure. For example, if an investor in the aforementioned junk bond fund anticipates a meaningful rise in high yield default rates, she may start looking for something a bit safer…perhaps a fund with “Investment Grade Corporate” in the name or one that utilizes the Bloomberg US Credit Index which captures bonds with higher credit ratings.
What about funds which are arguably less descriptive in their name and thus do not fit neatly into this construct? Sticking an “opportunistic,” “dynamic,” or “unconstrained” in a name can make things a bit fuzzier. Even with a stated benchmark, the manager has already hinted that they may be doing something a bit “differently.” And investors in such a strategy might be forsaking the certainty of knowing roughly what to expect if they have a gander at its holdings.
When Ambiguity Might Be a Blessing
This uncertainty, however, can be viewed positively for at least two reasons. The received wisdom in asset allocation has been twofold. First, bonds are a diversifier when paired with equities. Second, because of their coupon flows—a built-in contributor to return—bonds produce both a less volatile return stream than equities and one that is more likely to be positive in any given period.2 However, faithfully clinging to past practice can be at your portfolio’s peril.
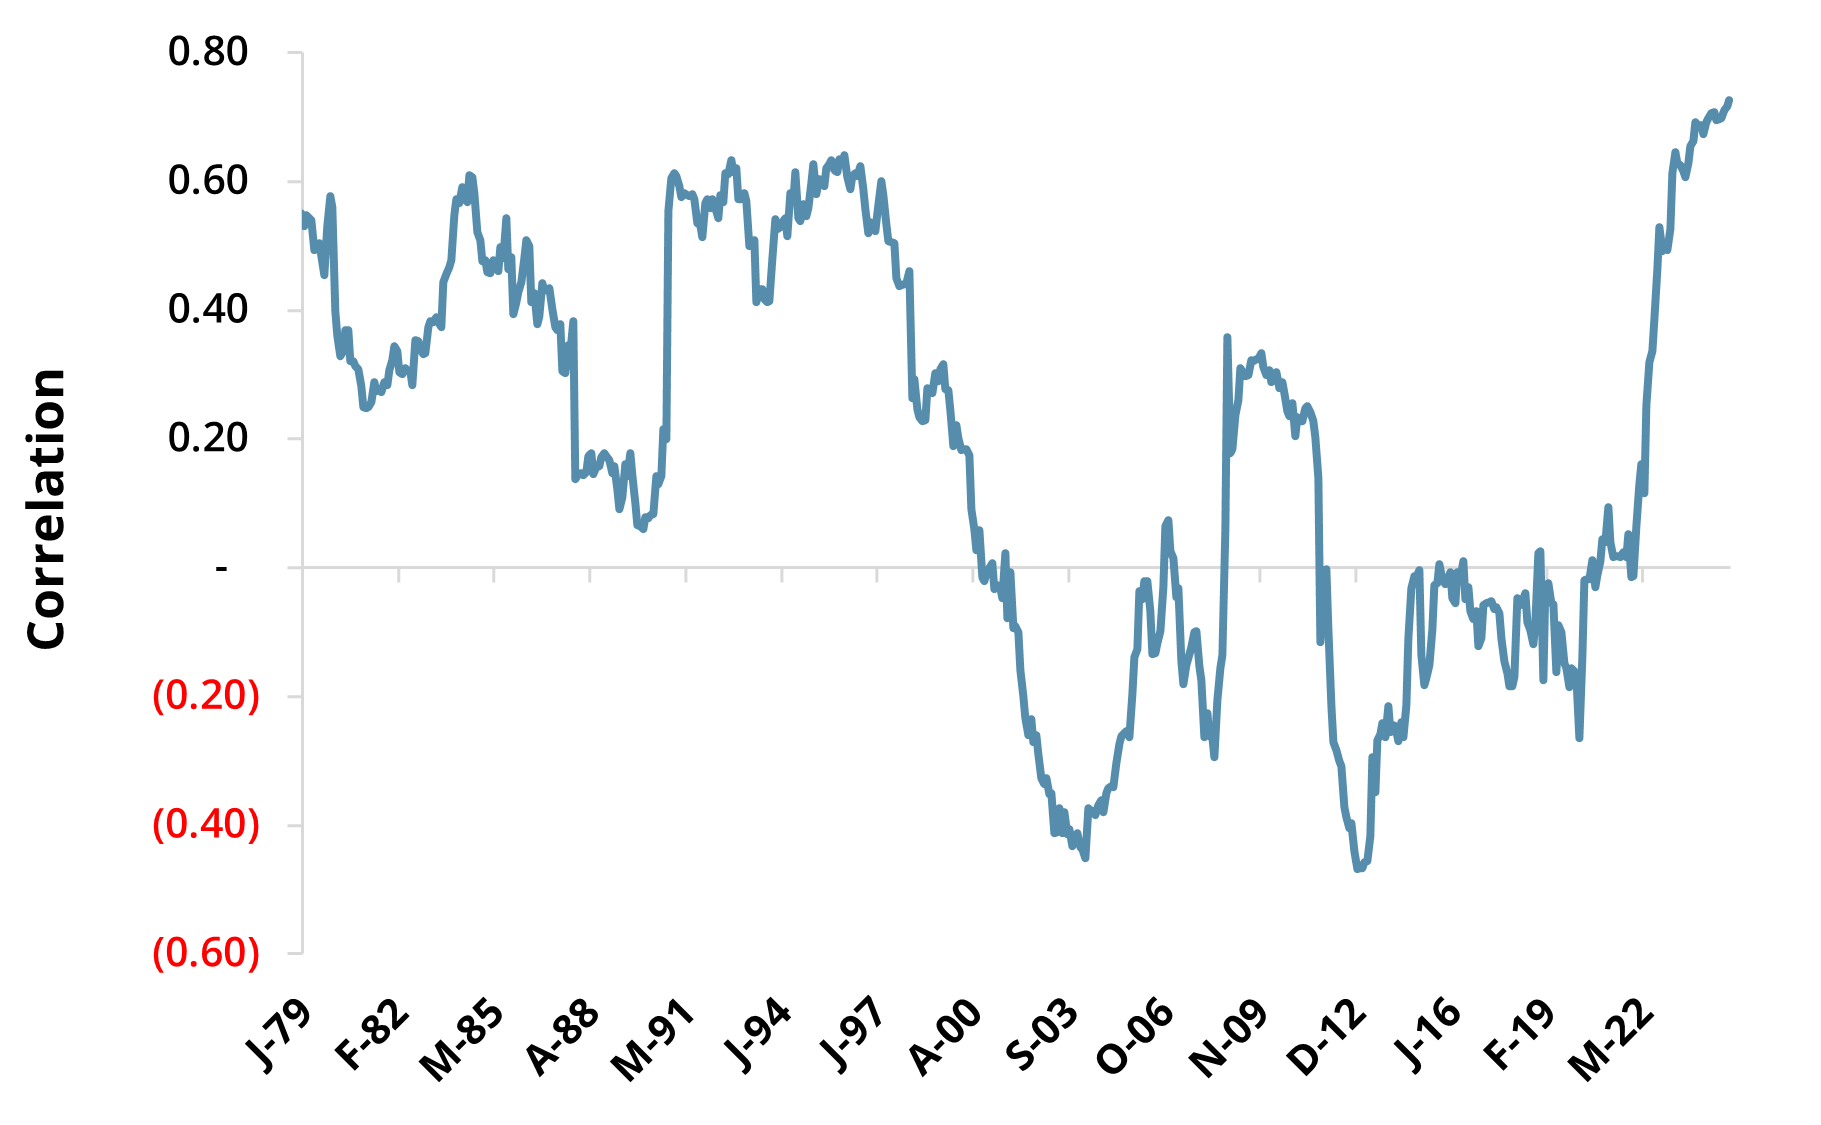
The rising correlation between stocks and bonds weakens this diversification argument. As Figure 1 shows, periods of co-movement are hardly a rarity. However, the rolling 3-year correlation between the S&P 500 Index and the Bloomberg U.S. Aggregate Bond Index returns closed 2024 in excess of 0.7, a high over the common period available.
Figure 1: S&P:US Agg Rolling 3-Year Monthly Return Correlation
Jan'76 - Dec '24
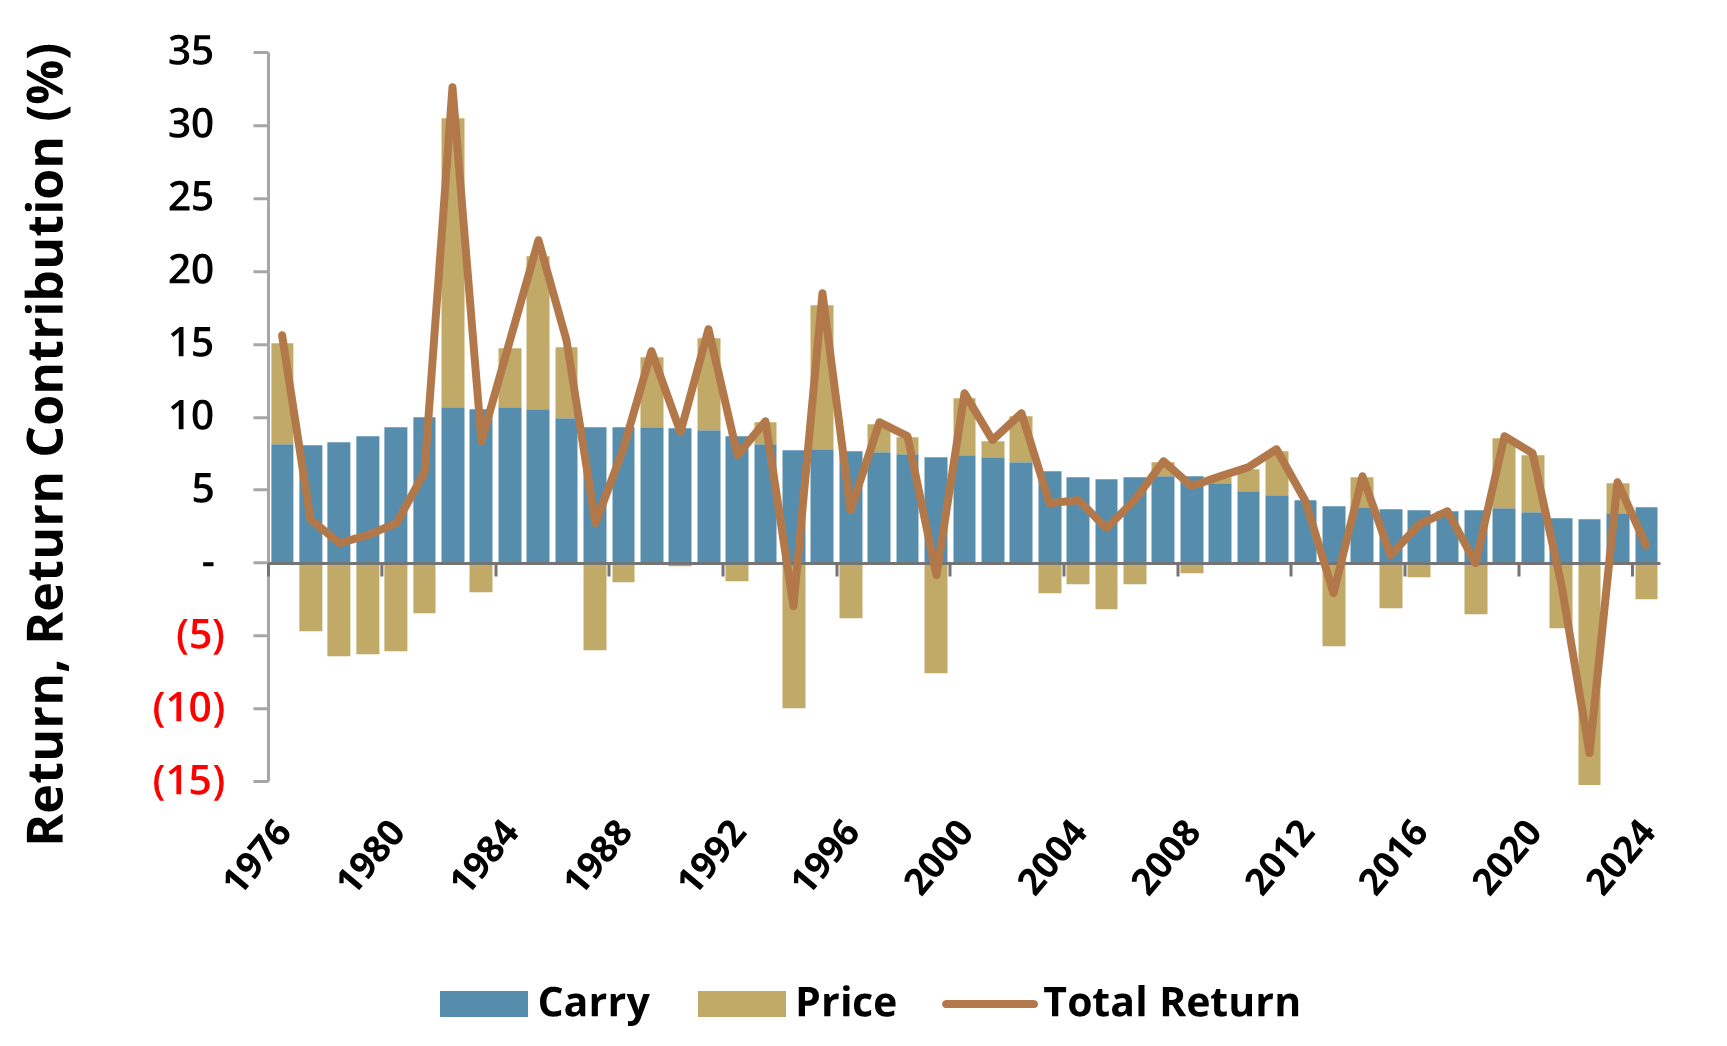
Moreover, as investors have seen several times over the past decade, bonds can produce negative or nearly nil returns, coupons notwithstanding. Figure 2 decomposes the total return of the Bloomberg U.S. Aggregate Bond Index into carry, which captures the coupon stream, and price return, which owes largely to interest rate movements. In seven of the past ten years, the non-coupon component (the gold bars) detracted from the return. The key takeaway: with interest rates having been low (and the corollary: with durations having extended), it may seem reasonable to question the notion that “bonds are more likely to be positive.”
Figure 2: Bloomberg U.S. Aggregate Bond Index
Annual Return Decomposition
1976 – 2024
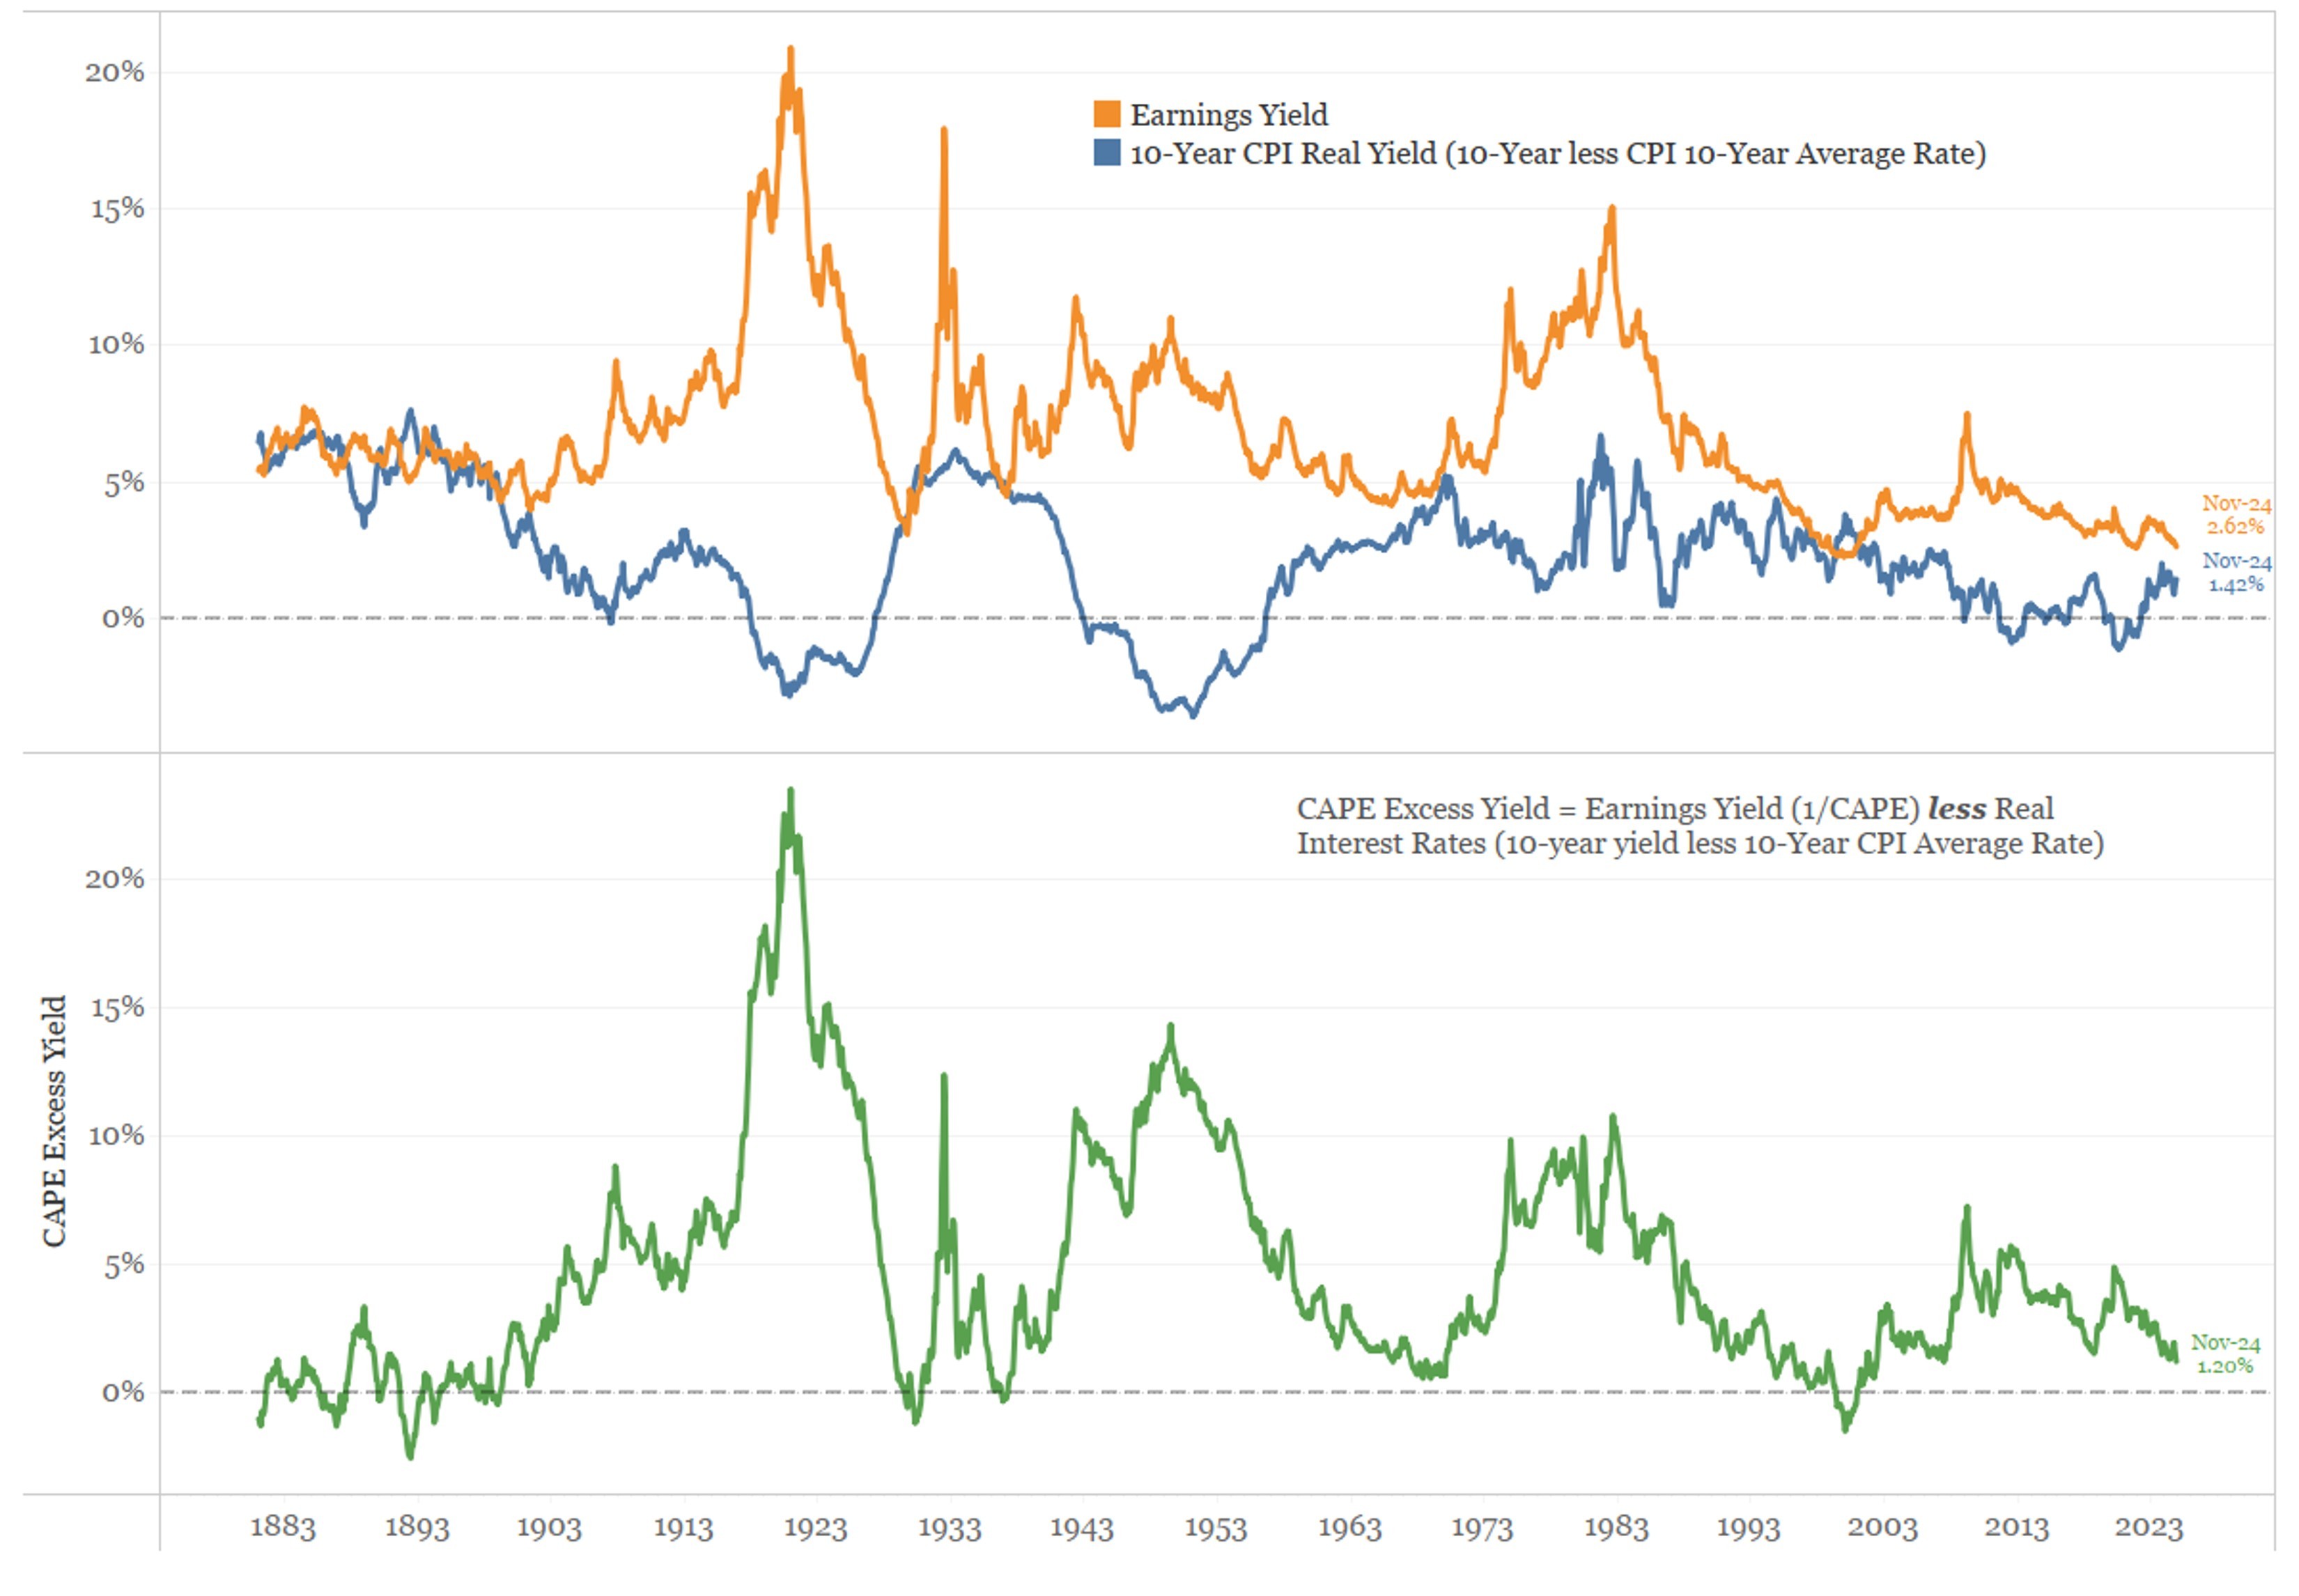
The goal here is to encourage investors to find new and innovative ways to make their bond allocations work harder from both an income generation and diversification perspective. It is most certainly not to dissuade them from maintaining bond allocations. In fact, the ever-insightful James Bianco—after looking at the meager excess of the Cyclically Adjusted Price-to-Earnings (CAPE) yield over 10-year real interest rates shown in Figure 3 (which he has kindly allowed for the reproduction of here)—quipped “fixed income should be competitive with stocks.” Part of this stems from rates having risen off their secular lows, part comes from the current valuation of the equity market. Both of these current realities suggest it might be unwise to forsake fixed income.
Figure 3: CAPE Excess Yield
How can an investor reconcile these seemingly competing notions of (a) using bonds as a return driver, (b) holding fixed income for diversification purposes, and (c) acknowledging that value in the debt markets varies widely across sectors?
Cue the “Opportunistic” Fund
Regardless of the adjective a manager uses to dissociate a fund from the narrow confines of a benchmark—opportunistic, dynamic, unconstrained, flexible, etc.—the intention is usually the same. That is, to suggest that the fund’s mandate is to seek value wherever the manager finds it rather than limiting her choices to a well-defined corner of the market as specified by the benchmark.
The goal of such “unbounded” strategies is usually to provide investors with a better experience compared to a benchmark-like exposure. This could include higher return, lower volatility, less correlation with the market, or some combination of the three. A manager will often achieve this by taking potentially large and differentiated exposures compared to a fund’s bogey.
The list of deviations such a fund might hold can take many forms. A small sampling includes interest rate positioning, exploiting idiosyncratic credit situations, identifying mispricings in relationships between securities or markets, and capitalizing on inefficiency in complex or poorly understood sectors.
To be clear, none of this is easy to execute. There is, of course, the challenge of sourcing investment ideas. Equally importantly, putting them together in a manner that achieves appropriate portfolio level diversification requires stringent risk management. And frankly, it takes a lot of mental fortitude (readers may be able to think of more colorful terms) to hold individual positions that depart so strikingly from the benchmark, let alone an entire portfolio that bears little resemblance to it.
However, when done correctly, such an approach can yield (no pun intended) significant benefits, harnessing the return-generating power of fixed income while retaining the traditional diversification benefits of a bond allocation. And it can do so more efficiently, as measured by its Sharpe ratio, meaning investors can allocate more to it and achieve better total portfolio outcomes.
CRDT Is a Powerful Way to Invest Opportunistically
By definition, any opportunistic approach is active. CRDT is sub-advised by Asterozoa Management. Asterozoa’s approach is grounded in the expertise of its principals and eschews a benchmark-centric approach as well as any fixed allocations. Instead, CRDT invests more opportunistically with an absolute return mindset based on where Asterozoa identifies value. The fund focuses its risk-taking on three primary areas where they have built a comparative advantage over decades of investment experience:
Macro Positioning: CRDT employs a quantitative approach for monitoring relationships between sectors, issuers, and securities. The goal is to identify mispricings where payoff profiles are highly asymmetric. In other words, where a normalization of pricing is both likely and profitable. Resultant positions are likely to include pairs of longs and shorts in very liquid markets.
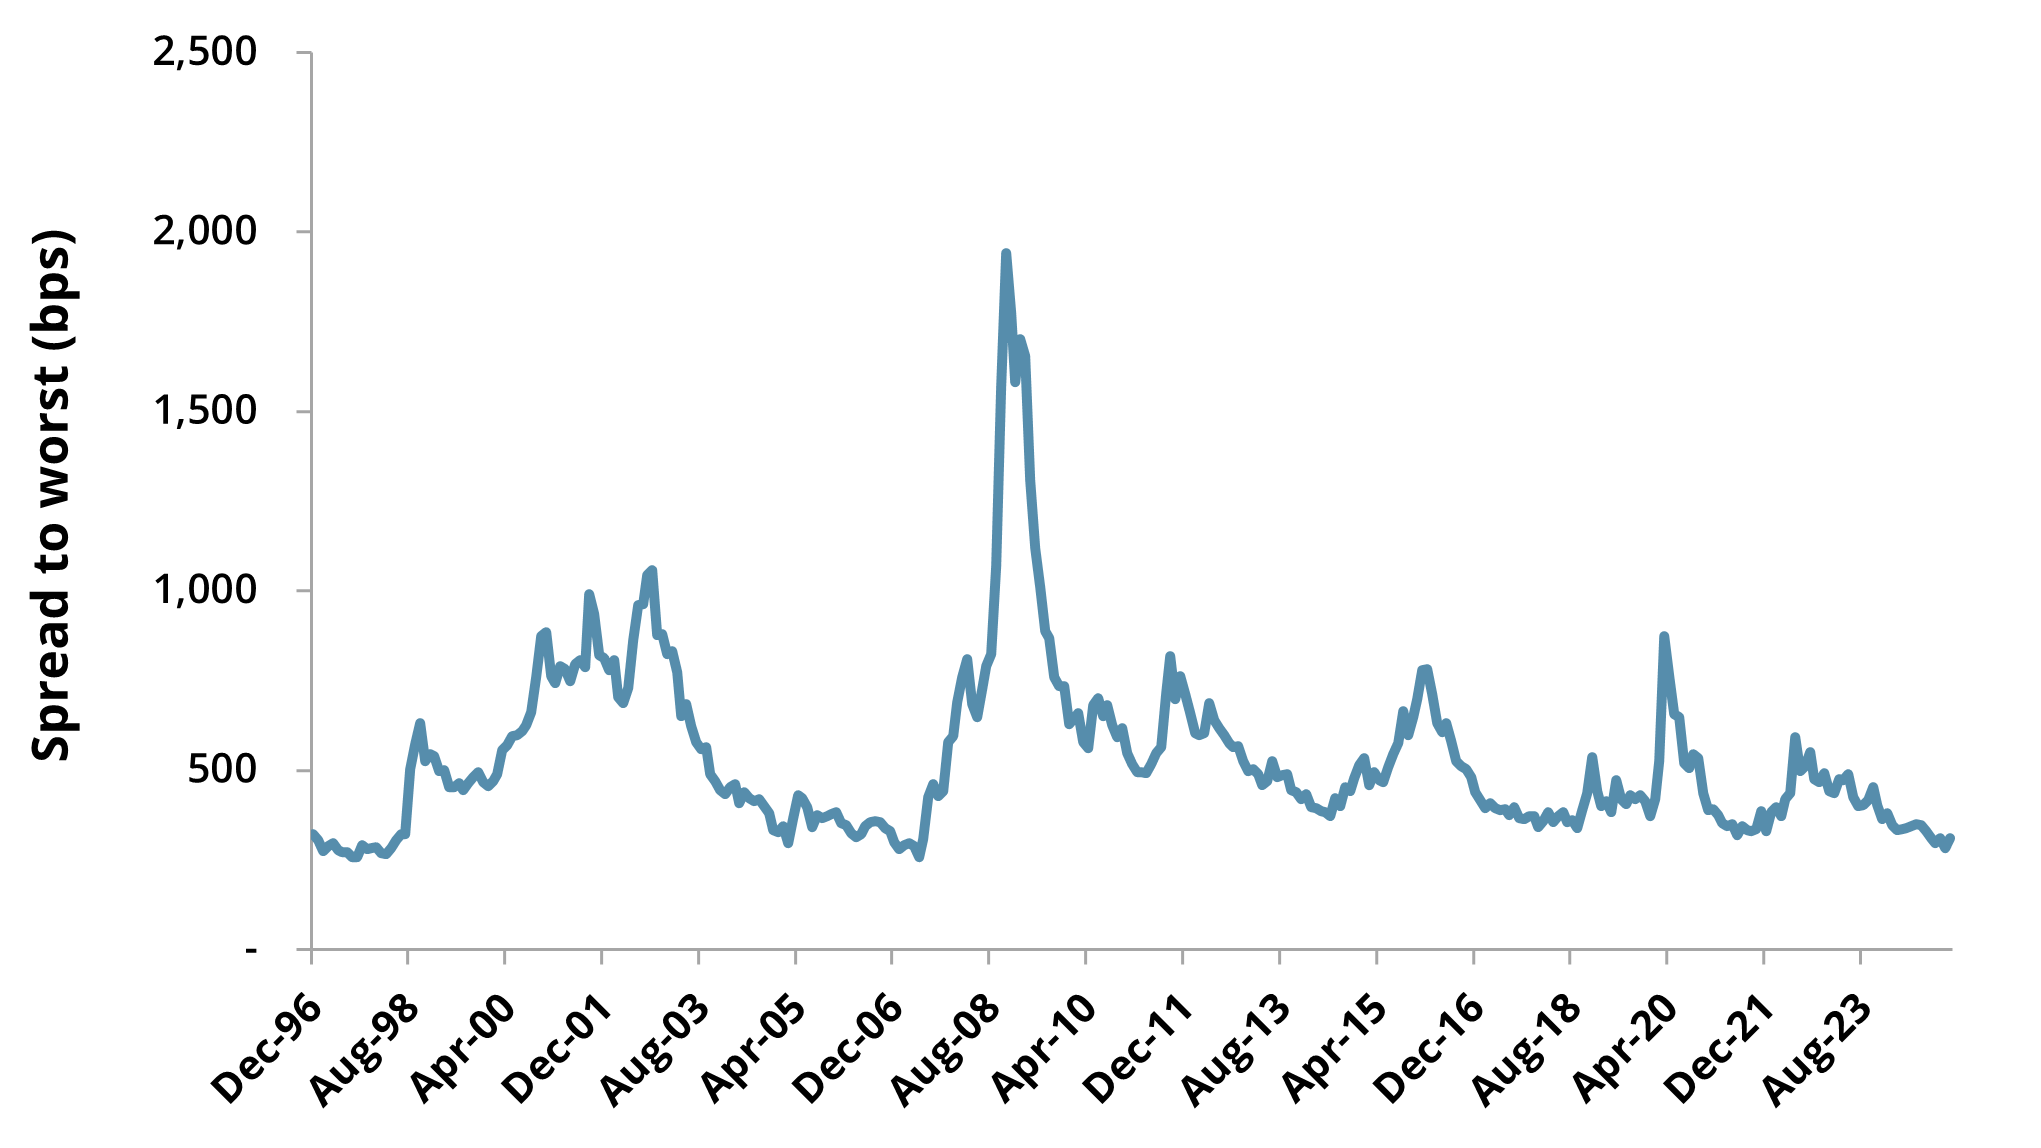
- Macro in action: As shown in Figure 4, spreads in the High Yield market are hovering near the tightest levels ever observed despite heightened geopolitical and business cycle uncertainty. Not only is the likelihood of a move high given the tightness of the current spread, but when widenings off cyclical lows have occurred, they have historically been sizable.
- To take advantage of this high probability/high payoff situation, CRDT has bought protection through index credit default swaps (CDS) which will profit if spreads rise. Incidentally, these swaps also serve as a hedge for some of CRDT’s credit exposure and should provide a meaningful performance boost when the business cycle turns. However, the precise timing of any reversion in spreads to more normal levels is difficult to predict and the volatility of CDS pricing is high which leads to a modestly sized position.
Figure 4: ICE BofA US High Yield Index, Spread to Worst
Dec'96 - Feb'25
- Structured Product: CRDT aims to exploit market inefficiencies in the valuation of complex and difficult-to-model securities. The uncertainty around the likelihood and timing of cash flows, their often-contingent nature, and the prevalence of structural enhancements like tranching and credit subordination tend to produce wide variations in the assessment of relative value for securities in this sector. The team employs a combination of fundamental research and traditional due diligence, proprietary modeling, and scenario analysis to identify attractive opportunities. Notably, this portion of the portfolio is generally comprised of more liquid and defensive holdings alongside those that might be considered higher risk.
Structured product in action: As Figure 5 shows, the number of homes available for sale in the U.S. has fallen precipitously from a peak of nearly twelve months to the current three-and-a-half months. This lack of supply should be supportive of home prices.
Figure 5: U.S. Existing Home Sales
Jan'99 - Jan'25
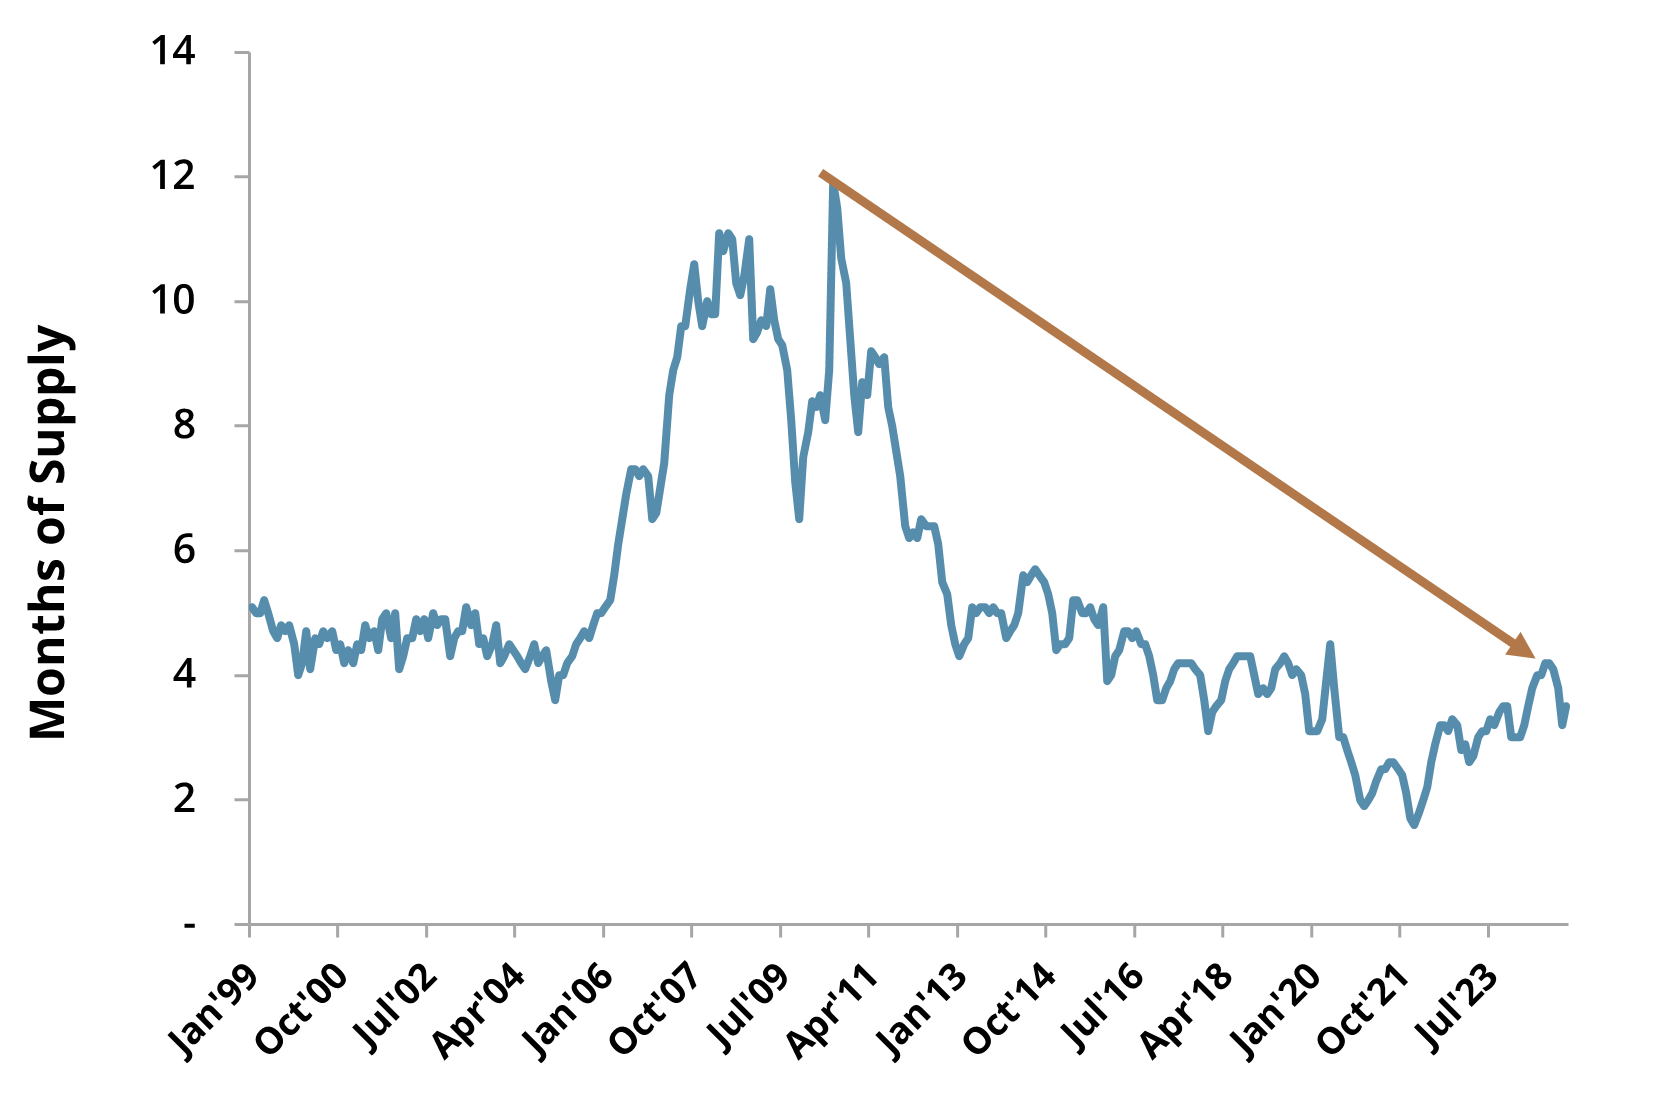
Source: Bloomberg - Over that same period shown above, lending regulations that were enacted in the wake of the 2008 crisis—specifically the Truth in Lending-Real Estate Settlement Procedures Act (TILA-RESPA) and Ability-to-Pay (ATR) rules—have significantly improved the mortgage-lending and underwriting process.
Finally, it is worth noting, as shown in Figure 6 below, that consumer debt in the U.S. as a share of Gross Domestic Product (GDP) has fallen meaningfully, which should likewise be supportive of housing.
Figure 6: Household Debt to GDP, United States
Jan'05 - Aug'24
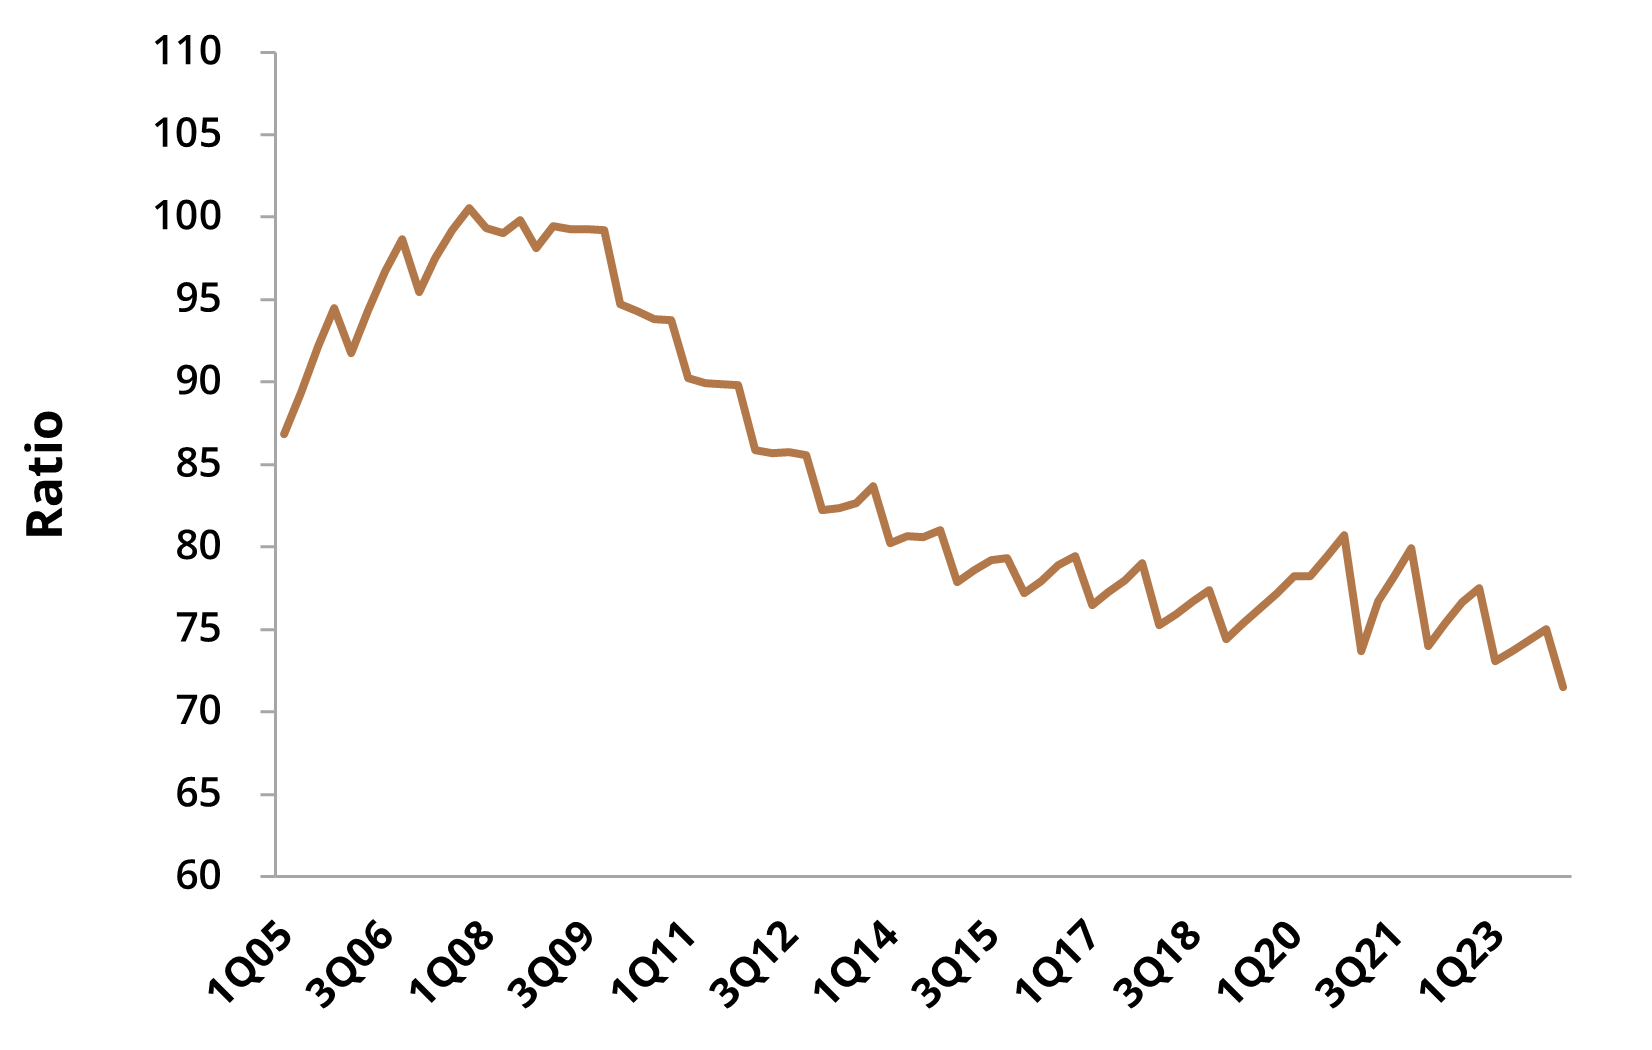
Source: Federal Reserve Economic Data (FRED) - CRDT has invested in bonds backed by U.S. housing. This includes securities backed by short-term mortgages as well as rents from leased homes. Not only are these supported by residential housing equity, but they offer short duration with low convexity and provide a comparatively high income stream.
- Idiosyncratic Credit: CRDT participates selectively in corporate restructuring stories that the team has long followed, thoroughly understands, and has high conviction in. The result is a parsimonious number of positions—each with its own unique set of catalysts and timing—with significant potential payoffs.
- Idiosyncratic credit in action: Brazilian airline Azul has faced significant headwinds in recent years, accentuated by the pandemic. In 2024, the company undertook significant cost-cutting measures alongside a debt restructuring, which pushed out many of its upcoming maturities and enabled it to become cash-flow positive. It was also able to raise fresh capital.
- Meanwhile, the Brazilian government, seeking to support a national champion airline, has backed a potential merger with Azul’s competitor Gol, which could further enhance value for creditors.
- Asterozoa has long covered Azul in depth and built a position in one of the near-term maturity bonds whose remaining principal had been reduced significantly during the restructuring. It offers a very attractive yield in light of the company’s strengthened debt service capacity. The distinct nature of the situation helps to insulate its performance from broader market moves, allowing for a modestly sized exposure in CRDT.
Turning to CRDT’s risk management approach, the three distinct return drivers above provide some natural diversification. However, positions are sized based on potential payoff, level of conviction, and volatility to ensure that no one position dominates performance. Moreover, the fund takes advantage of its size to move nimbly as views and valuations change.
Compared to how a typical benchmark-oriented portfolio might produce returns, CRDT exhibits a lot of “substitution” effects. For example, the complexity premium that the structured product holdings aim to capitalize on can provide a powerful offset to a generally more cautious duration stance when interest rates decline. Alternatively, idiosyncratic and macro positions can serve as a placeholder for the credit factor on which many funds consistently lean for alpha (and which can occasionally pinch their performance during periods of credit spread widening).
The resulting portfolio aims to deliver a return profile which is less correlated with a benchmark. While this naturally leads to a higher level of tracking error compared to traditional funds, that seems a worthwhile tradeoff in exchange for returns which—over time—exhibit lower volatility and are more consistently positive compared to benchmark-tethered strategies.
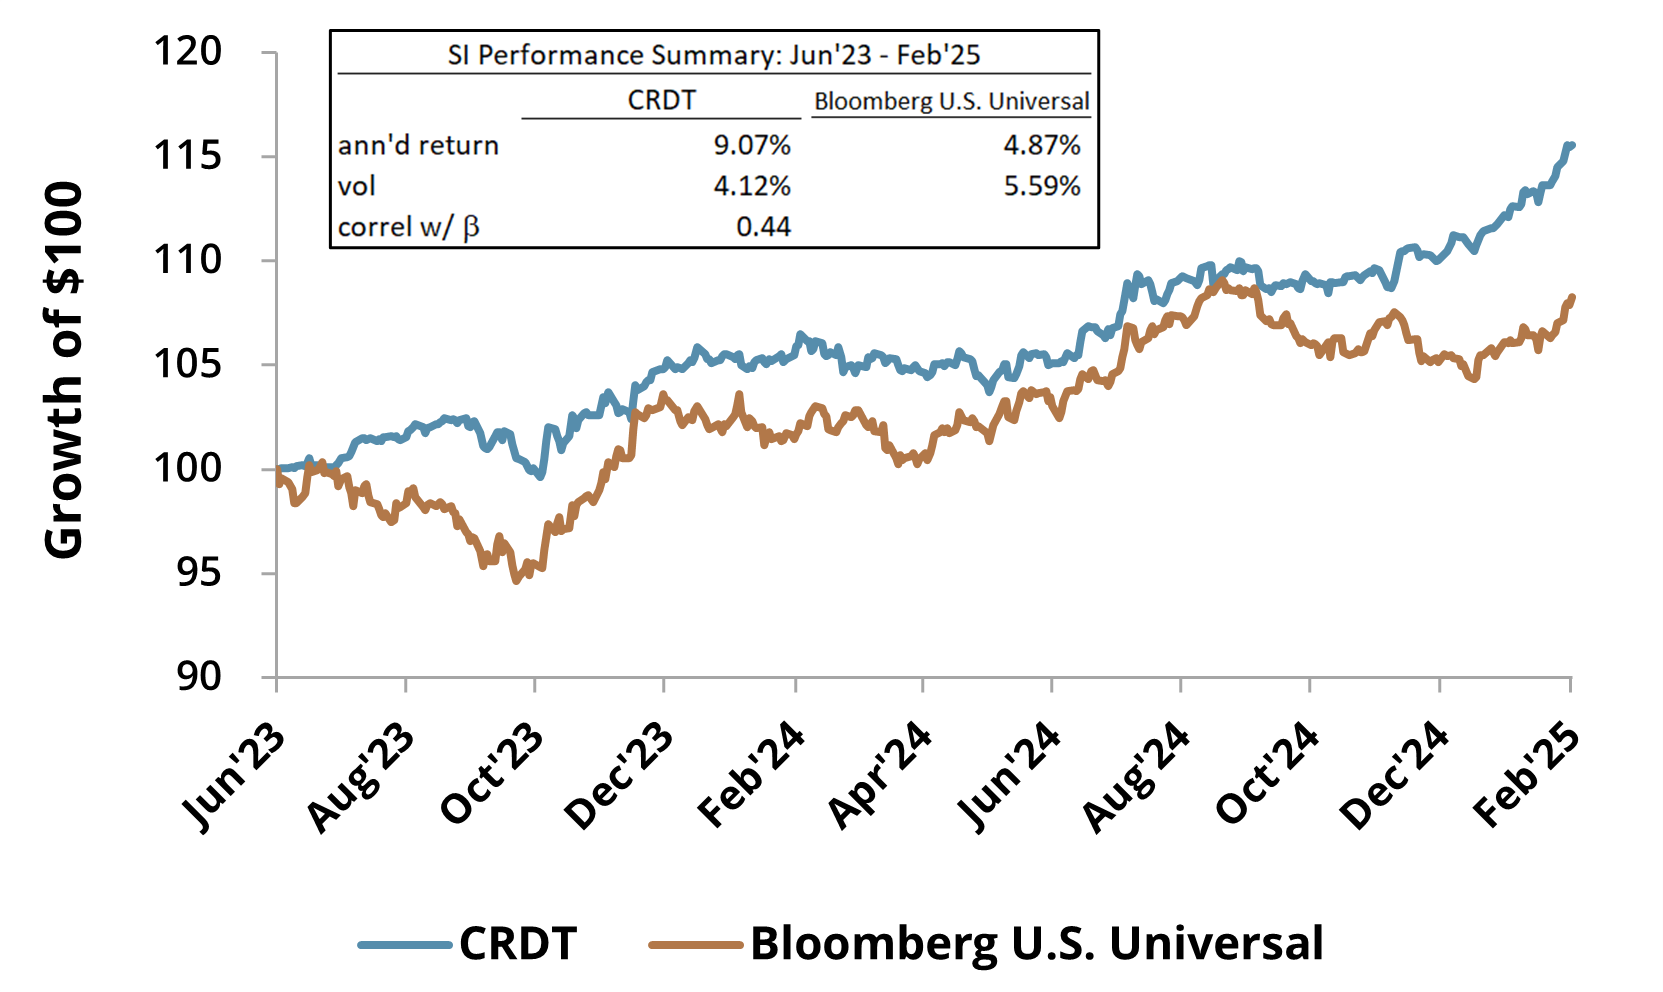
As shown in Figure 7, since its mid-2023 inception, CRDT’s opportunistic approach has delivered strong returns to investors, not only in absolute terms but relative to its stated benchmark, the Bloomberg U.S. Universal Index. Simultaneously, its differentiated exposures have helped it to navigate market drawdowns well, affording investors some protection during selloffs. Moreover, it has done so with less volatility than—and limited correlation to—the benchmark.
Figure 7: CRDT vs. Bloomberg U.S. Universal Index
Jun'23 - Feb'25
In Conclusion
CRDT offers an efficient, transparent, and—most importantly—opportunistic approach to maximizing the benefits of a bond allocation. By focusing on extracting value across sectors and irrespective of benchmark composition, the fund aims to move bond allocations away from “fixed” and more towards income and return while enhancing the diversification benefits in a total portfolio context. Having delivered results consistent with this objective, CRDT’s strong since-inception performance makes a compelling case for investors to consider an allocation.
1Starting in 2001, the SEC promulgated guidance—known as the “Names Rule”—to ensure that fund names align with their holdings (using an 80% test) and to reduce the likelihood that investors could be misled about a fund’s contents and risks.
2Over the 49 years shown later in Figure 2, bonds had a positive calendar year return 90% of the time compared to about 75% of the time for equities. This is true despite the S&P having a higher annualized return than the Bloomberg U.S. Aggregate Bond Index over the same period (8.9% vs 6.5%).
GLOSSARY
Alpha: An investment strategy's ability to beat the market, or its "edge." Alpha is thus also often referred to as “excess return” or the “abnormal rate of return” in relation to a benchmark, when adjusted for risk.
Basis Points (bps): A common unit of measure for interest rates and other percentages in finance. One basis point is equal to 1/100th of 1%, or 0.01%.
Bloomberg U.S. Aggregate Bond Index: A broad-based flagship benchmark that measures the investment grade, US dollar-denominated, fixed-rate taxable bond market. The index includes Treasuries, government-related and corporate securities, MBS (agency fixed-rate pass-throughs), ABS and CMBS (agency and non-agency).
Bloomberg U.S. Credit Index: Measures the investment grade, US dollar-denominated, fixed-rate, taxable corporate and government-related bond markets. It is composed of the US Corporate Index and a non-corporate component that includes non-US agencies, sovereigns, supranationals and local authorities.
Bloomberg U.S. Universal Index: Represents the union of the US Aggregate Index, US Corporate High Yield Index, Investment Grade 144A Index, Eurodollar Index, US Emerging Markets Index, and the non-ERISA eligible portion of the CMBS Index. The index covers USD-denominated, taxable bonds that are rated either investment grade or high-yield. Some US Universal Index constituents may be eligible for one or more of its contributing subcomponents that are not mutually exclusive. These securities are not double-counted in the index.
Carry: The return obtained from holding an asset assuming the underlying price of the asset remains stable.
CDS (Credit Default Swap): A financial derivative that allows an investor to swap or offset their credit risk with that of another investor.
Convexity: A measure of how the duration of a bond changes as interest rates change. The greater the convexity of a bond, the greater that change will be for a specific interest rate shift.
Cyclically Adjusted Price-to-Earnings (CAPE) Yield: The inverse of the CAPE ratio. The CAPE ratio is calculated as the price of security (i.e. an individual stock or a stock index) divided by the inflation-adjusted average of the prior ten years of earnings.
Coupon: The annual interest rate paid on a bond, expressed as a percentage of the face value and paid from the issue date until maturity.
Credit Subordination: The ranking of one obligation of a debtor below its more senior obligations in the determination of repayment priority to creditors.
Duration: A measure of the sensitivity of the price of a bond or other debt instrument to a change in interest rates.
ICE BofA U.S. High Yield Index: Tracks the performance of U.S. dollar denominated below investment grade corporate debt publicly issued in the U.S. domestic market.
Investment Grade (IG) Rating: A credit rating that signifies the risk of default for a municipal or corporate bond issuer and is assigned by credit rating firms such as Standard & Poor’s (S&P), Moody's, and Fitch. IG ratings range from "AAA" to "BBB". An investment grade rating signals that a corporate or municipal bond has a relatively low risk of default.
Junk Bond: A high-yield, high-risk security, typically issued by a company seeking to raise capital quickly in order to finance a takeover.
S&P 500 Index: The index includes 500 leading U.S. large cap companies and captures approximately 80% coverage of the available market.
Sharpe Ratio: The ratio compares the return of an investment with its risk. It's a mathematical expression of the insight that excess returns over a period of time may signify more volatility and risk, rather than investing skill.
Tracking Error: The divergence between the price behavior of a position or a portfolio and the price behavior of a benchmark.
Tranching: The process of splitting a credit obligation into a number of components with each having different characteristics.
Volatility: A measure of how much and how quickly prices move over a given span of time.