
Share
In Summary
1. India is a compelling standalone story: Rising incomes—sufficient to push ever more of the population into the middle class—underpin a virtuous cycle that benefits consumer-oriented companies and businesses levered to the economy’s transition from informal to formal. Moreover, India’s well-educated yet low-wage labor force is attracting foreign capital into the manufacturing sector, helping to reinforce India’s unfolding upward mobility story. In contrast to other countries with rising prosperity, India’s population heft truly distinguishes it and merits its place in investors’ portfolios. However, passive broad market exposure to India dilutes the potential of the most attractive segments of the market.
2. India is already capturing significant investor inflows: While money appears to be flowing into Emerging Market (EM) Equity ETFs from non-ETFs, India-focused offerings have captured a sizable share of the flows into those ETFs.3. The Simplify Tara India Opportunities ETF (IOPP) is an ideal way to access potentially attractive returns: A team with the local presence, the expertise, and the experience to navigate the opportunities utilizing a process attuned to the nuances of the Indian market.
India is a compelling standalone story
We are not making any sort of “this time is different” claim with respect to India. Quite the contrary: the evidence suggests India is following a path well-trodden by countries progressing from low to middle-income status. As populations move away from subsistence living—essentially climbing Maslow’s Pyramid of Needs—the discretionary component of income rises. And this has historically led to increased spending on personal consumption: the things we want rather than just the things we need.
a) Support for domestically focused industries: It would have seemed illogical for, say Poland, to encourage the development of a domestically focused automobile industry to cater solely to the aspirations of a “mere” 38mn post-Soviet consumers in 1991, most of whom were far from being considered middle class.1 But in India, the middle class is already nearly 600 million people and likely growing between 2 and 3% per year. For reference, the middle class in the United States is just over fifty percent of the population, or about 171 million people.2 So India’s middle class—its core consumption engine—is already three-and-a-half times as large as America’s. In this context, there is ample scope for the development of large-scale local enterprises to cater to their aspirations.
b) Competition within local industries: The counterpart to the above is that India’s consumer class is large enough to support competition among purveyors of goods and services. Like any situation where consumers have a choice, some businesses may not survive, but it does present an opportunity for an active manager to select winners and avoid losers.
c) Valuation skew: We would also argue that in the case of India, which has a well-developed equity market with ample diversification among industries, traditional pricing models will tend to make stocks with sustained high growth prospects look expensive on a multiples basis.
Analysts typically assume more conservative earnings growth beyond the relatively short, often three-year, horizons of their models. But if instead one views earnings as having a long runway of high growth—exceeding what the market is expecting—one would still see value in buying stocks at what might be optically high valuation multiples.
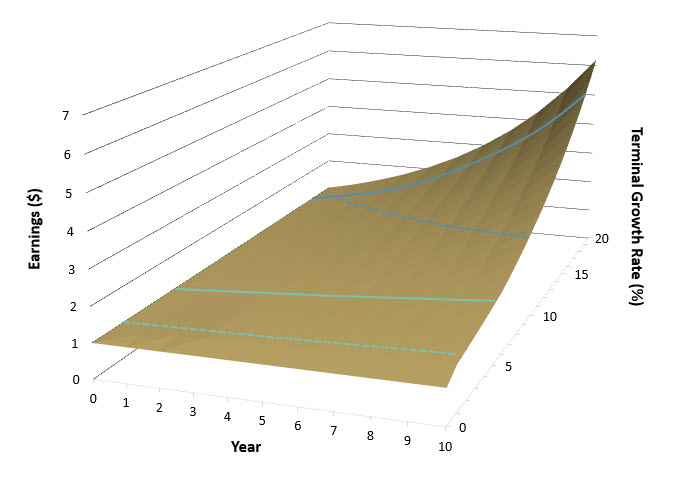
How much difference can higher earnings growth make? Figure 1 below shows the influence of terminal growth rate, defined as anything beyond year three, on earnings over a ten-year horizon. The solid teal line highlights the average S&P 500 earnings compound annual growth rate since the turn of the century of around 6%. Assuming this level of earnings growth persists, today’s $1 of earnings becomes $1.79 of earnings ten years from now. If we want to forecast conservatively and cut the distant year earnings growth by half, we end up following the dashed teal line with terminal earnings of $1.46.
Earnings of domestically focused Indian stocks, however, have been growing at just over 19% per year for the past five years.3 If earnings growth holds at this level, this year’s $1 of earnings becomes a lofty $5.87 as depicted by the blue line. And even if we want to tamp down our enthusiasm with a 50% reduction in earnings growth in the out-years, we will follow the dashed blue line, ending up with $3.25 of earnings by the end of the horizon, a still impressive pickup versus our hypothetical 6% earnings growth for S&P stocks.
Putting this back into forward P/E ratio terms: an investor willing to pay the current S&P 500 multiple of 24x for that $3.25 of earnings might be willing to pay $78 for the stock. But the investor forecasting 6% earnings growth for three years followed by a leveling off at 3% growth would see that as an eye-watering 53x P/E ratio. And as it turns out, the average forward P/E for stocks held in IOPP is ~50x which we view as attractive given the potential earnings growth.4
Why all the fixation on India’s domestically oriented stocks? Well, frankly, a good portion of the names in the India benchmark index have little to do with India proper. The Energy and IT sectors are about 11% each. The behavior of the former is largely a function of global energy market movements even if most of their sales trace to domestic energy consumption. Perhaps unsurprisingly, the IT names—most of whose revenues originate from outside India—tend to behave a lot like the NASDAQ Composite. Similarly, the stocks in the Pharmaceutical sector of the index are global companies. Consequently, exposure to the broad stock market indices dilutes one of the main motivations for investing in India: leveraging yourself to the local beneficiaries of the growth story.
India’s rising income story manifests itself in what we view as three durable and attractive investment themes. First, satisfying the demands of the expanding middle class directly benefits consumer-oriented companies. Second, as the economy transitions from an informal one to a more formal and more inclusive one, technology companies, financial services providers, and transportation companies who can help connect and digitalize the population will benefit. Thirdly, India’s well-educated workforce and relatively low wage structure do make it an attractive destination for investment in higher value-added manufacturing which will not only benefit certain industries but help to reinforce the two other themes.
India is already capturing significant investor inflows
U.S.-listed Emerging Market Equity ETFs have experienced inflows of nearly $9bn in the first half of 2024 even as non-ETF structures in the asset class have experienced outflows.5 India has been a favored pick among those allocating to the space: among the U.S.-listed India ETFs we track, YTD inflows tally to $4.7bn, or over half of the money that has come in. Summarily, investors are voting for India with their dollars.
IOPP is an ideal way to access potentially attractive returns
While our categorical view is that the best long-term opportunities within India are those names benefiting from the above themes, we advocate for an active approach. IOPP is sub-advised by System Two Advisors. System Two’s principals, who co-founded the firm twelve years ago have—along with their 65 colleagues in four offices throughout India—decades of experience in India’s markets.
In addition to serving as the sub-advisor for IOPP, System Two manages other India-focused strategies, each of which can potentially benefit investors in IOPP. System Two’s hedge fund operates across the full breadth of market opportunities in India, from fixed income to equity, cash to derivative instruments, and public to private issuers, and affords the team a holistic view on the market along with insights that managers focused only on the stock market—or managers with no on the ground presence—might miss. Its proprietary high-frequency trading strategy enables it to understand the market mechanics extraordinarily well and helps to ensure the best execution. And its long-only private fund, which incepted nearly four years ago and whose mandate largely mirrors IOPP’s, uses an identical and well-honed investment process.
Digging into the investment process, it starts with a combination of discretionary stock identification by the team and a fundamentals-based quantitative screen to narrow the universe of over 6,500 listed companies down to 200 to 300 names. Each of these are then analyzed using a four-pillar framework that considers the defensibility of the business model, management quality, growth drivers, and future potential. The roughly 80 names that pass through the four pillar framework are then subjected to additional scrutiny including stress-testing, face-to-face engagement with management, valuation analysis, and internal debate. 20-40 stocks on which the team has the highest conviction are then selected for inclusion in the portfolio.
As shown in Figure 2, the favored investment themes are reflected in the wide sector divergences versus the benchmark. For example, the portfolio is overweight those sectors most levered to domestic expansion and inclusive growth such as Communication Services, Consumer Discretionary, and Consumer Staples. At the same, it has taken large underweights in sectors that are not really levered to India-specific earnings drivers such as Energy.
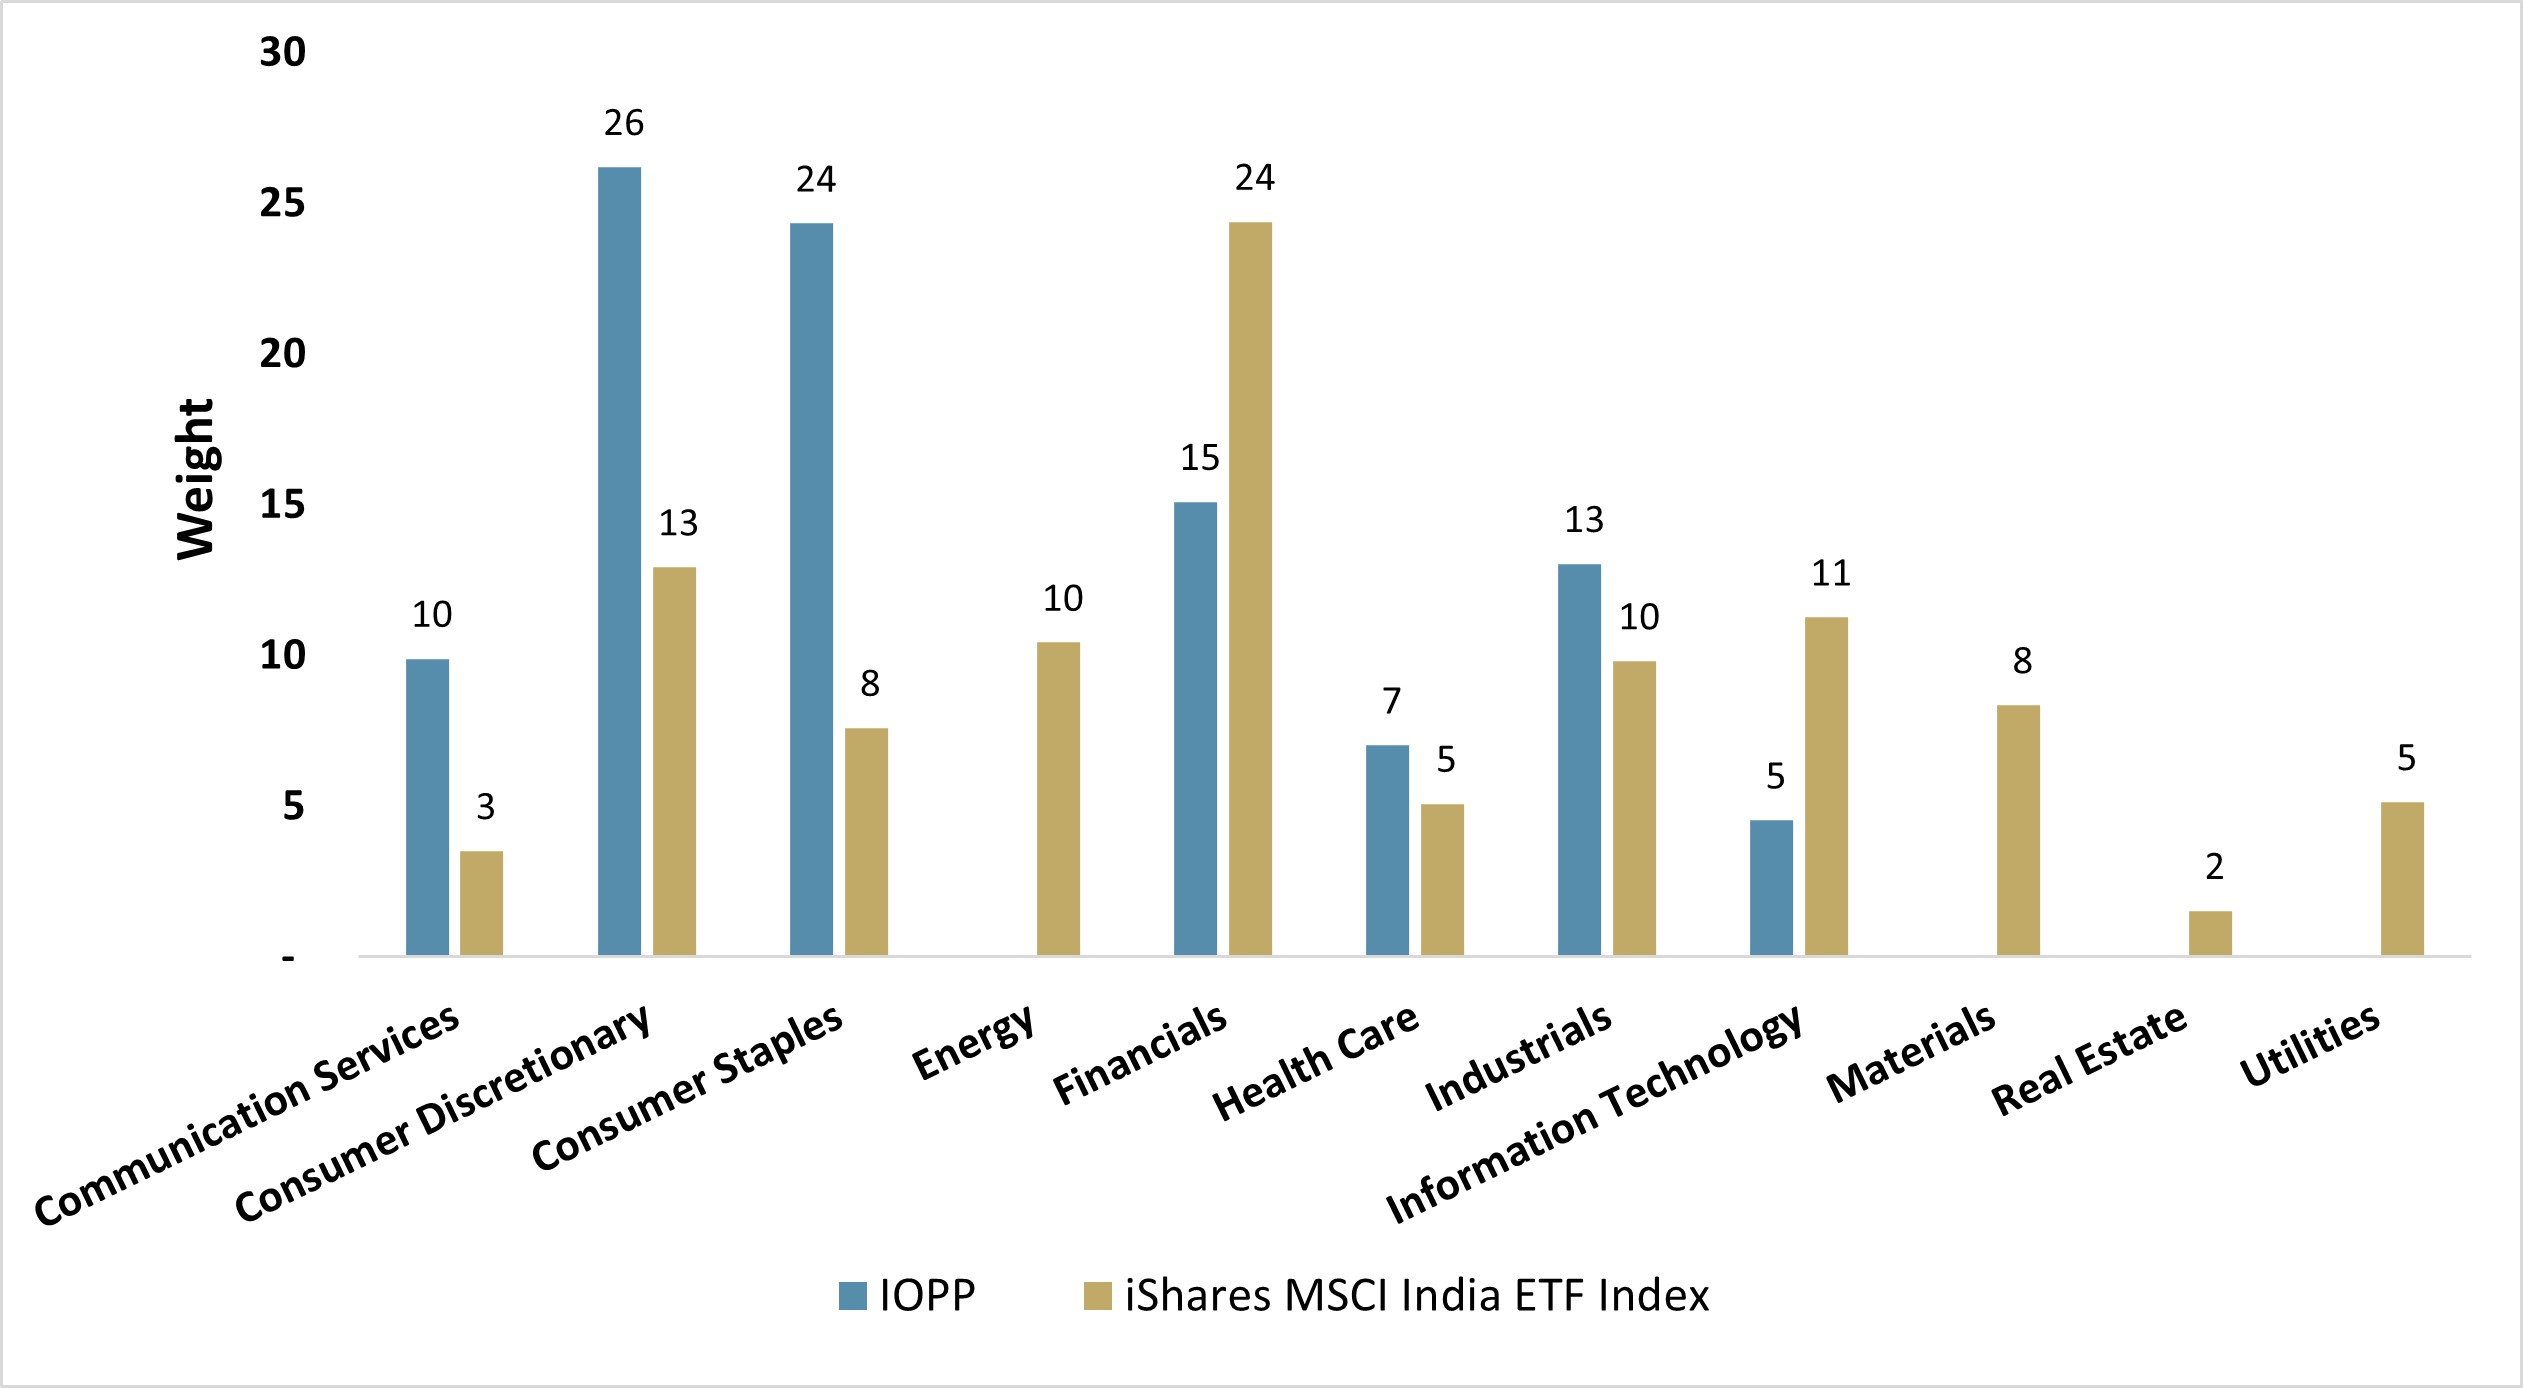
The domestic consumption theme manifests itself mainly thru sector selection. Note the most sizable o/w positions are in Consumer Discretionary and Consumer Staples. And despite the Energy names deriving most revenue locally, they remain beholden to global energy price movements, making the sector at best a second derivative beneficiary of increasing domestic consumption and thus an underweight.
Alongside the sector tilts, we expect stock selection to be an equally important driver of performance given System Two’s well-resourced team and rigorous investment process. Figure 3 shows the very high active shares within nearly every sector. Even in the Industrials sector, where this is a modest overweight, the underlying positions exhibit almost no overlap with the benchmark, highlighting System Two’s ability to tap names that passive investors are simply forsaking. Overall portfolio active share is currently running about 80%.
While System Two constructs IOPP with a benchmark-agnostic mindset, it does employ limits on individual name and sector exposures with periodic reviews triggered by price movements to ensure that no single position or industry dominates performance.
Figure 3: Active Share by Sector
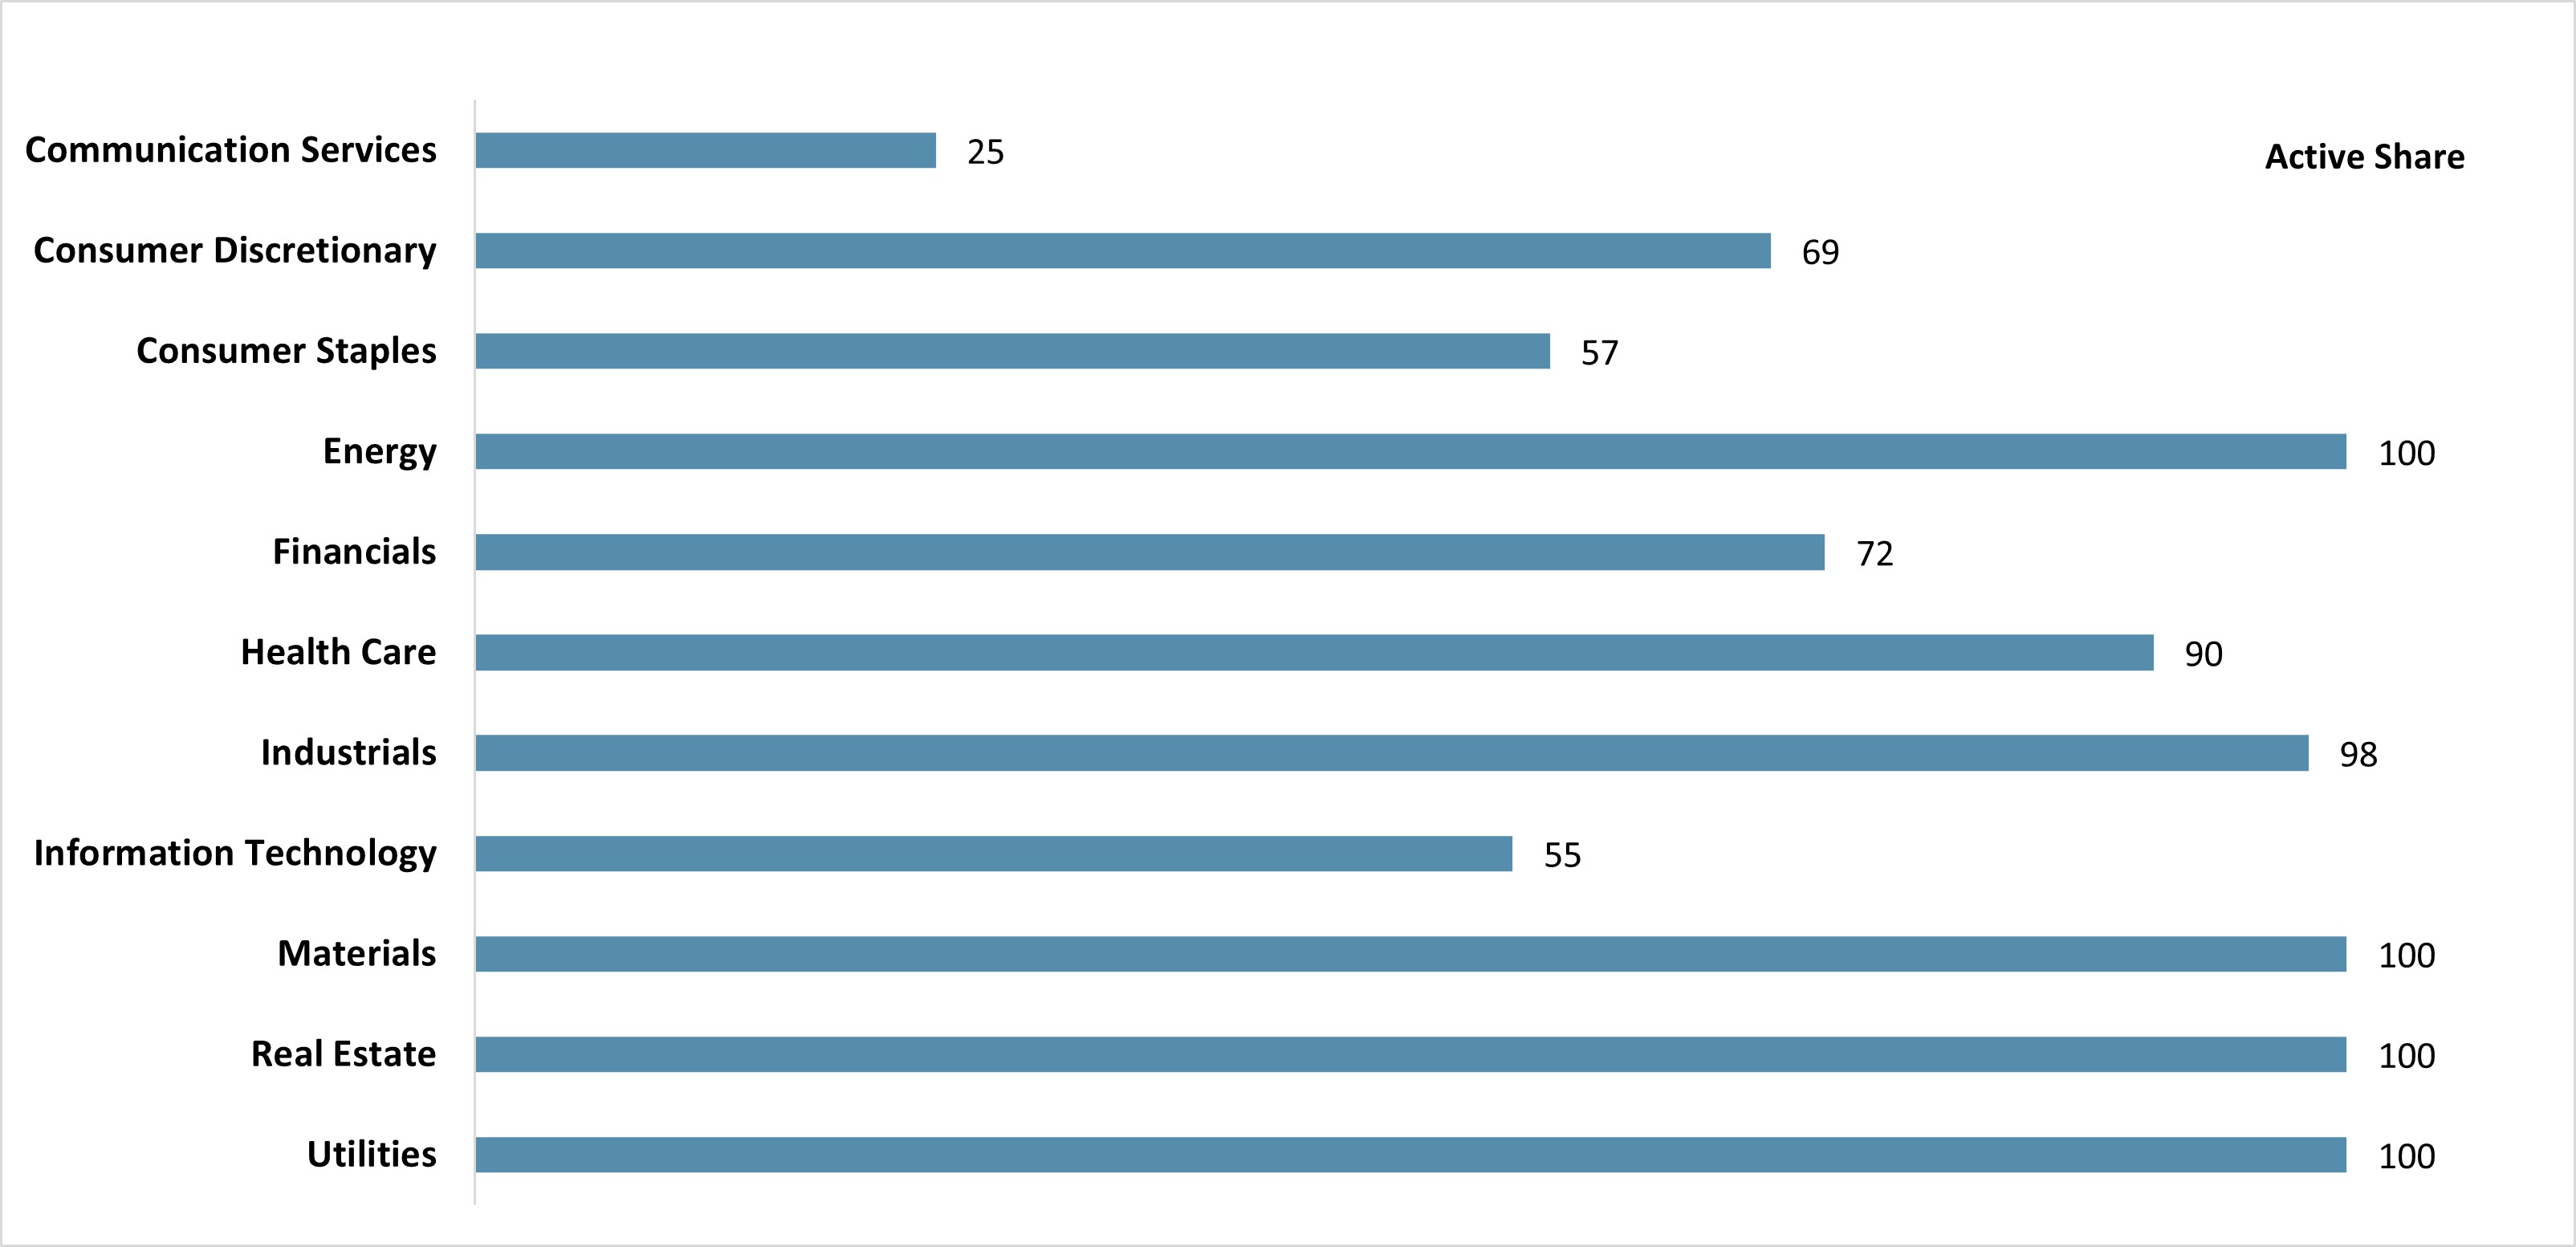
System Two leverages its team and rigorous investment process to place significant bets versus the benchmark in stock selection. Regardless of the relative sector positioning, the wide divergence of individual name selection compared to the benchmark is reflected in very high active shares with each sector.
Use Cases of IOPP
• Diversification from U.S. Equity exposure withoutsacrificing return potential
• A partial substitute for broad EM Equity exposure
• A focused offering for investors looking to tailor their
geographic exposures
Parting Words
We view India as a strong contender for inclusion in investors’ portfolios. There is some merit to the simple notion of geographical diversification: India will likely be the third-largest economy in the world in the not-too-distant future. However, we believe the more compelling rationale owes to the durable tailwinds that provide a long runway of earnings growth for companies levered to rising incomes, an expanding domestic market for goods and services, and high value-added manufacturing. And while strong inflows suggest that India is getting due recognition, we believe investors are best served by an active approach underpinned by a diligent process geared towards selecting the best opportunities in this vast market.We have already been in touch with quite a few investors considering IOPP. The questions below are some of the most frequently asked in these conversations. If you would like to discuss IOPP, have questions, or if there is any additional information you would like, we welcome the opportunity to connect and encourage you to reach out to Simplify.
Q. Does IOPP have currency exposure?
A. Yes. We expect that investors seeking exposure to the Indian equity market will expect to simultaneously have exposure to the Indian rupee (INR) in which the stocks are denominated. That said, System Two could employ currency hedging if it has a high conviction view on likely INR weakness.
Q. Are there really that many companies listed in India?
A. Yes…6,819 across the National Stock Exchange and Bombay Stock Exchange (for reference, there are ~3,700 in the U.S.). The prevalence of names in India owes in part to family-owned companies which have gone public. And while a company must float at least 25% of its equity to go public, many listed names are still controlled by the founding family. As an integral part of its four-pillar process, System Two analyzes the transparency, integrity, and competence of management teams. But in cases where a founding family is still involved or retains a large equity stake, special scrutiny is placed on the treatment of minority shareholders.
Q. If it’s indeed benchmark agnostic, how might I think about integrating IOPP with my existing portfolio?
A. While the portfolio is constructed and risk-managed without reference to a benchmark, IOPP’s goal over a market cycle is to deliver better returns than the MSCI India Net Total Return Index.
1Poland’s automobile industry is in fact significant but focused primarily on the production of parts for export.
2Kochhar, Rakesh (2024, May 31). The State of the American Middle Class. Pew Research Center.
3Average is taken over the MSCI Emerging Markets India Net TR index constituents for which 5yr EPS CAGR are available on Bloomberg as of July 8, 2024 and for which geographic revenue breakdowns are available on Bloomberg and indicate at least 75% of revenues derive from India.
4Weighted average as of July 19, 2024
5Perlman, David (2024, July 2). ETF Flows – 2Q24. UBS & J.P. Morgan (2024, July 5). EM Money Trail:
Six weeks of a dry summer.
GLOSSARY:
Active Share: The extent to which an actively managed portfolio diverges from a benchmark or other reference portfolio expressed as a percentage.
Multiples: Ratios used to facilitate valuation comparisons of one stock to another, often based on dividing a market-observed variable (e.g., the price of a stock) by a fundamental variable (e.g. earnings or book value).
P/E Ratio: A commonly used method of normalizing stock prices by each company’s current or expected earnings in order to make comparisons among them.